AI Trade Grading: Score Setups A+ to F Before You Enter
Most traders take trades they shouldn't. AI grades your chart A+ to F in seconds so you only enter A/B+ setups and skip the rest. Step-by-step guide.
Most traders don't lose money because their strategy is bad. They lose because they take too many mediocre setups. Profitable traders almost always share one habit: they grade every setup before clicking buy. AI makes that step take seconds instead of minutes. Here's how to actually use it.
How Do You Use AI to Grade a Trading Setup?
Screenshot the chart with your indicators visible, upload it to an AI chart analysis tool, and read the letter grade it returns. The AI scores pattern quality, indicator alignment, volume confirmation, and risk/reward in a few seconds, then outputs a grade from A+ to F along with suggested entry, stop, and target levels. Set a minimum grade you will trade (most traders use B+), take the setup only if it clears that floor, and skip everything below it. Do this before every entry so the grade becomes a gate rather than an afterthought.
Why Grading Setups Matters
Every trader has taken a trade they knew was marginal. The pattern wasn't quite right, volume was thin, R:R was barely 1:1, but the stock was "moving" so they clicked buy anyway. That's where most accounts bleed money. Not one catastrophic loss. A slow drip of C-grade setups over weeks.
Grading a setup before you take it forces you to answer one question: is this worth the risk? It isn't a prediction. It's a count of how many things are actually in your favor right now. Grade enough trades and a pattern emerges in your own data. Your A-grades win at a much higher rate than your C-grades, and after a while you stop taking the C-grades.
The problem is doing this by hand. When a stock is ripping, the last thing you want to do is spend five minutes on a mental checklist. Confirmation bias takes over and you see what you want to see. That's the part AI is actually good at. It looks at the same chart in a few seconds, scores multiple factors at once, and doesn't care that you're excited.
The math behind grading
Say A-grades win 65% at 2:1, and C-grades win 40% at 1.5:1. Over 100 trades, the A-grade trader is comfortably green and the C-grade trader is breakeven or worse. Same stocks, same patterns, same strategy. The only thing that changed is what they were willing to take.
What Makes a Chart Gradeable
Before the AI can grade anything, your screenshot has to be readable. The grader is looking at pixels, not your broker. A surprising number of bad grades trace back to the screenshot, not the setup. Going through actual SnapPChart uploads, the same four problems keep showing up: missing indicators, cropped axes, phone photos of a monitor with hands in the frame, or a chart zoomed in so tight the AI is staring at ten candles with no context.
Fix those four things and the grade is actually about your setup. Skip them and even a real A+ trade comes back with a low confidence score.
Indicators in the panel
Volume bars, at least one moving average (EMA 9 / 20 / 50, or VWAP for intraday), and a momentum oscillator like MACD or RSI. If your chart only shows candles, the AI can read price action but can't grade confluence. Confluence is the gap between a B and a B+.
X and Y axis visible
The price scale on the right and the time scale on the bottom both need to be in frame. Crop them out and the AI can describe the shape of the candles, but it can't pin an entry, stop, or target to a real price. Most "the AI gave me weird numbers" complaints trace back to a missing y-axis.
Clean, focused capture
Use the platform's built-in screenshot or an OS screenshot. Not a phone photo of your monitor. Uploads come in with hands holding a phone, MacBook keyboards reflected in the glass, browser bookmark bars, Discord overlays. The AI grades all of it. A reflection sitting on top of a wick gets treated as a wick.
Full chart, not the last 10 candles
Zoom out so the AI can see what came before the setup. A bull flag with no flagpole on screen is just a tight range. A breakout with no prior consolidation visible is just one green candle. Show enough bars to capture the trend, the recent swing levels, and the move that made the setup interesting. Usually 60 to 150 candles is enough.
Practical rule
Open the chart on your desktop platform, hide the watchlist sidebar, expand the chart to fill the window, then screenshot. If you can read the price ticks on the right edge and see the last hour or two of price action without scrolling, the AI can grade it.
Pattern, indicator alignment, volume and risk-reward are what the AI is actually scoring. It can only score what it can see. If you're still learning to spot those structures on your own, start with the complete guide to reading stock charts to build the base. The grade gets a lot more useful when you can sanity-check it against your own read.
Step-by-Step: How to Grade a Setup with AI
This is the exact process I use to grade a setup with AI. Works for stocks, forex, crypto, anything with candlestick charts and indicators.
Capture Your Chart Screenshot
Open your chart in TradingView, thinkorswim, whatever you use. Before you screenshot, get the right indicators on screen. At minimum: candlesticks, volume, and at least one moving average (EMA 9 or 20 are the usual day-trading defaults). For intraday, VWAP is non-negotiable.
Zoom so the pattern you're evaluating is fully visible. For a bull flag, both the flagpole and the consolidation channel need to be in frame. For an ascending triangle, show enough bars to see the flat resistance and the rising lows.
Pro tip: include RSI or MACD at the bottom of your chart if you use them. The AI reads those panes and folds them into the grade. More signal in, better grade out.
Upload to an AI Analysis Tool
Drop the screenshot into an AI chart analysis tool like SnapPChart. The model reads the candlesticks, identifies the pattern, picks up the indicator positions, measures volume and works out R:R, all from one image.
It takes a few seconds. Under the hood it's evaluating dozens of things at once: pattern type and quality, trend direction, volume vs average, price relative to VWAP and the moving averages, where the momentum indicators sit, and the distance between a sensible entry, stop and target.
Read the Grade and Understand What It Means
You get back a letter grade from A+ to F. It's not a vibe. It's a weighted score across every factor the model checked. Here's what each tier means in practice:
High confluence. Clean pattern, real volume, indicators aligned, R:R working in your favor. These are your bread-and-butter trades.
Good setup with one or two minor issues. Maybe volume is a touch light or one indicator is neutral. Still tradeable for most strategies.
Marginal. Some factors support the trade, others don't. These are the ones that look tempting in real time and quietly cost you money over a large sample.
Low quality or no valid setup. Conflicting signals, ugly R:R, or no recognizable pattern. Skip.
Check the Entry, Stop Loss, and Targets
You also get specific trade levels: where to enter, where the stop goes, where to take profits. The model derives them from chart structure, support and resistance, the pattern's measured move and key price zones.
SnapPChart gives you multi-target exits (T1 partial, T2 full), a stop-loss rationale explaining why the stop sits where it does, and a trailing stop plan for managing the trade once you're in. There's also a bear case, the thing that would invalidate the setup before price ever touches your stop.
Compare the AI's levels to your own. If they line up, that's extra confirmation. If the AI puts the stop somewhere different from you, dig into why. It might be reading a support level you missed, or you might have context it doesn't (like a catalyst or sector momentum).
Make Your Decision
This is the part that requires discipline. A or B+ is a green light. Take the trade with the entry, stop and targets from the analysis. C or below, skip. No exceptions.
Sounds simple. It's where most traders fall over. The stock is moving, you can see the dollars, sitting it out feels like leaving money on the table. The data still wins. Trading only high-grade setups beats trading everything you see, and one bad trade you skipped usually pays for more than three marginal winners.
The grade isn't telling you what to do. It's handing you a piece of objective data so you can make a better call. You're still the trader. You just have a second opinion that doesn't care about FOMO, greed, or your last loss.
Real Example: What a Gradeable Chart Looks Like
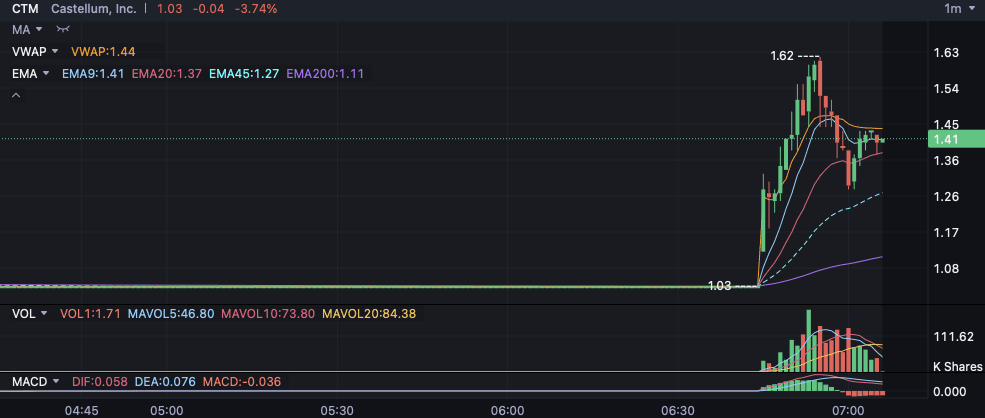
The four criteria above are easier to see on an actual chart than read in a list. Below is a small-cap momentum screenshot. It's the kind of upload that grades cleanly because the AI can see everything it needs. Use it as a visual reference before you send your own.
Why this one is gradeable
Walk through it against the four criteria from the previous section. Every box gets a check, which is what you want before you upload anything:
Indicators are all on the chart
VWAP and EMA 9 / 20 / 45 / 200 are stacked on the price panel with values labelled in the top-left. Volume bars and a 5/10/20-period volume MA sit in the middle pane. MACD is broken out into its own pane at the bottom. That's enough for the AI to grade trend, participation and momentum at the same time.
Both axes are visible
Prices on the right edge (1.08, 1.17, 1.26, 1.36, 1.45, 1.54, 1.63), 1-minute timestamps across the bottom (04:45, 05:00, 05:30, 06:00, 06:30, 07:00). Without those, an entry like "buy near 1.42" can't exist. It just becomes "buy near the 9 EMA somewhere."
Clean, focused capture
Pulled straight from the charting platform. No phone in the frame, no keyboard, no browser bookmark bar, no Discord overlay, no glare. The AI only has to look at chart pixels.
Full context, not the last 10 candles
You can see the entire vertical move from $1.03 up to the $1.62 high, the rejection candles after, and the pullback consolidating around VWAP. Crop this down to the last ten bars and the AI sees a tight range with no story. Same chart, much weaker grade.
Whether this specific setup grades A, B or C is a separate question. That's the AI's job once it has the screenshot. The point of the example is the screenshot itself. If your own uploads hit all four of these, the grade you get back is actually about your setup, not your picture.
Real Examples: A-Grade vs C-Grade Setups
Easier to see than describe. Here's what the AI weighs, and how the same pattern can grade very differently depending on context.
Bull Flag
- Clean flagpole with 3x average volume
- Tight consolidation channel on declining volume
- Price holding above VWAP and EMA 9
- Risk-reward ratio of 3:1 with stop below flag
- RSI pulling back from overbought, not diverging
Bull Flag
- Flagpole on average volume, no surge
- Wide, sloppy consolidation with large wicks
- Price below VWAP, fighting the trend
- Risk-reward barely 1:1 due to wide stop
- RSI showing bearish divergence
Both charts are technically a bull flag. A trader scanning fast might take either one. The AI sees the gap immediately: the A-grade has five things going for it, the C-grade has multiple red flags. Over time, the trader who skips the second one and waits for the first one wins by a lot. For more on which indicators matter most for day trading, check out the indicator guide.
Building a Grading Habit
Grading one setup is useful. Grading every setup is what changes your P&L. The goal is to make it automatic, a step you never skip, like checking your mirrors. Here's how to wire it in.
Grade before every trade, no exceptions
Hard rule: no grade, no trade. This kills impulse entries on the spot. Within a week you'll notice you start filtering out weak setups before you even reach for the screenshot button.
Track your grades over time
Keep a simple log of grades next to your trade results. After 30 to 50 trades, look at the data. What's your win rate on A-grades vs B-grades vs C-grades? The numbers reinforce the habit because you can see, in your own results, that higher grades win more.
Set a minimum grade threshold
Decide your floor in advance. Most profitable traders use B+. Anything below that gets skipped. Pre-deciding the rule removes the temptation to talk yourself into a bad setup in the moment.
Grade setups you don't plan to trade
Practice grading charts during quiet hours or after the close. It builds your intuition for what a high-grade vs low-grade setup actually looks like. Eventually you'll start clocking grade-worthy setups by eye, before the AI confirms.
Review skipped trades
At the end of the week, pull up the setups you graded C or below and skipped. How many would have been losers? Seeing the trades you avoided makes it easier to skip the next marginal one.
Common Mistakes When Using AI Chart Grading
AI grading is useful but easy to misuse. Here are the patterns I see come up most often, and how to dodge them.
Treating the grade as a buy signal
An A-grade isn't a buy recommendation. It tells you the chart structure is strong. It doesn't know about earnings, sector rotation, or breaking news. The AI grades the chart. You still own the bigger picture.
Uploading charts with missing indicators
Bare candlesticks with no volume, VWAP, or moving averages give the AI less to work with, and the grade gets less informative. Include the indicators you actually trade with. The AI can only score what it can see.
Re-uploading until you get the grade you want
Cropping differently, swapping timeframes, zooming in or out until the model finally says A. Defeats the point. If the grade isn't what you hoped, that's the signal. Accept it and move on to the next setup.
Ignoring the grade when the stock is moving
The hardest time to follow your own rules is when a stock is ripping and FOMO kicks in. That's when the grade matters most. Fast moves without a clean setup are the ones that reverse hardest and trap latecomers.
Not reviewing grade accuracy over time
If you never check whether higher grades actually correlate with better outcomes in your own trading, the whole thing becomes a ritual instead of a tool. Track your results by grade tier and adjust your floor based on your own data.
AI Pre-Trade Checklist
Decent traders run through a mental checklist before they enter. Is the pattern clean? Are the indicators aligned? Is the volume there? Is R:R any good? Mental checklists are inconsistent though. When you're excited or scared, steps get skipped. An AI pre-trade checklist runs the same checks every time, whether it's your first trade of the day or a fast move at 3:45 PM.
The workflow is short. Before every trade: (1) upload the chart, (2) read the grade, (3) only trade A and B+. Under 10 seconds, replacing a five-minute manual review that confirmation bias was already going to break. The AI looks at everything at once:
- Pattern quality. Is the chart pattern well-defined and historically reliable?
- Indicator alignment. Are MACD, EMA and VWAP backing the trade direction?
- Volume confirmation. Is volume above average and supporting the move?
- Risk / reward. Is the potential reward at least 2x the risk?
- Support / resistance context. Is the entry near support with room to run before resistance?
The grade is the final gate between your idea and your capital. Passes all five checks, you trade. Fails one, you wait. Over weeks and months that compounds. You take fewer trades, but the ones you take have better odds. Try it on your next setup with the AI chart analysis tool, or read more on getting a second opinion on your trade setup.
Grade Your Next Setup in Seconds
Upload a chart screenshot and get a grade, an entry, a stop and targets in seconds.
Try It FreeFrequently Asked Questions
How do you use AI to grade a trading setup?
Screenshot the chart with your indicators visible, upload it to an AI chart analysis tool, and read the letter grade it returns. The AI scores pattern quality, indicator alignment, volume confirmation, and risk/reward in a few seconds, then outputs a grade from A+ to F along with suggested entry, stop, and target levels. Set a minimum grade you will trade (most traders use B+), take the setup only if it clears that floor, and skip everything below it. Do this before every entry so the grade becomes a gate rather than an afterthought.
What does an A-grade trading setup look like?
An A-grade has a clearly defined chart pattern (bull flag, ascending triangle, etc.), real volume confirmation, indicators like VWAP and the moving averages all pointing the same way, and an R:R of at least 2:1. The pattern is clean, the trend is on your side, and there's a logical stop sitting close by. A-grades are the trades where everything lines up and you actually feel confident in the thesis.
How accurate is AI at grading chart setups?
AI chart grading reads visual patterns, indicator alignment, volume behavior and R:R at the same time. That's the part that takes a human trader several minutes per chart. The AI isn't predicting whether the trade wins or loses. It's counting how many technical factors are aligned in your favor. A higher grade means more confluence, and confluence historically correlates with higher-probability setups. Treat it as a second opinion that catches things you might miss.
Should I only trade A-grade setups?
Most experienced traders only take A and B+ setups. Anything C or below has fewer factors in its favor and tends to win less often over time. That said, even A-grades lose sometimes. No grade guarantees a winner. The point is to tilt the odds in your favor by consistently taking high-quality setups and skipping the marginal ones. Over 50 to 100 trades, that discipline shows up in your P&L.
Can I use AI grading for forex and crypto charts?
Yes. AI chart grading works on any market with standard candlestick charts and indicators. Forex pairs, crypto, stocks and ETFs all produce the same visual patterns: bull flags, triangles, support and resistance, moving average stacks. The AI grades the chart structure regardless of the underlying. Just include the indicators you normally trade with (VWAP may not apply on 24-hour markets, but moving averages and RSI work everywhere).
Disclaimer: This content is for educational purposes only and does not constitute financial advice. AI grading is a tool for evaluating chart structure, not a guarantee of trade outcomes. Always manage risk, use stop losses, and never trade with money you cannot afford to lose.
Continue Learning
Writes about AI-assisted day trading, technical analysis, and the systems traders actually use to stay disciplined.
Stop guessing whether the setup is clean.
Screenshot any chart and SnapPChart grades it A+ to F in seconds, with the entry, the stop, and the reasons spelled out.