AI chart analysis for any trading chart screenshot.
SnapPChart is an AI chart analysis tool that reads any stock, forex, crypto, futures, or ETF chart screenshot from TradingView, Webull, Robinhood, MetaTrader, or any broker. Upload the screenshot and the AI returns a setup grade, entry, stop loss, targets, and plain-English risk notes before you risk the trade.
Drag and drop your chart screenshot
or click to browse. PNG, JPG, or WebP.
Your first analysis is free. No credit card.
Make sure both the time axis (X) and price axis (Y) are visible in your screenshot for accurate results.
STOCKS
Momentum, breakout, pullback, and reversal setups
FOREX
Major pairs, crosses, XAUUSD, and session context
CRYPTO
Bitcoin, Ethereum, and high-beta altcoin charts
FUTURES
Index, commodity, and intraday futures screenshots
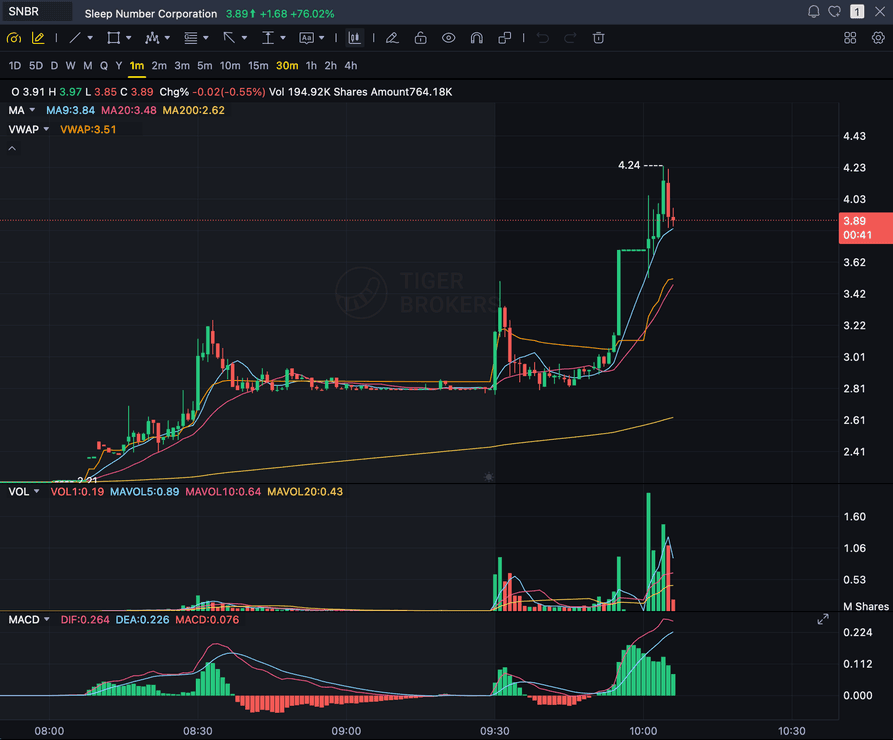
Grade
B+
Entry
$3.87
Stop
$3.75
Target
$4.24
Sample readout
SNBR 1m bull flag pullback: strong opening momentum, lighter-volume consolidation, and a late breakout attempt with the 3.89 price marker near the current candle.
Quick answer
What is AI chart screenshot analysis?
AI chart screenshot analysis is software that reads a trading chart image and turns it into a structured, repeatable trade review. SnapPChart reads the visible candles, trend, support and resistance, volume, indicators, and risk/reward directly from the screenshot, then returns an A-F setup grade, the likely pattern, an entry zone, a stop loss, profit targets, and the main reasons the trade could fail. It is most useful after you already found a possible setup in TradingView, Webull, Robinhood, MetaTrader, or a broker platform and want to confirm the chart is clean enough before entering. The point is not a second opinion for its own sake, it is the same read every time, so an A setup and a C setup are graded on identical criteria and your own bias does not get to move the grade.
What the AI Returns From a Screenshot
Use the output as a repeatable pre-trade checkpoint, not a prediction.
A-F Setup Grade
See whether the setup has enough pattern clarity, momentum, volume, and reward to justify the risk.
Entry, Stop, Targets
Get a structured trade plan with entry zone, invalidation level, targets, and risk/reward.
Screenshot-Based Read
Use charts from TradingView, Webull, ThinkOrSwim, MetaTrader, Robinhood, or any broker.
Risk Notes First
The analysis flags extension, messy chop, weak retests, thin reward, and conflicting indicators.
Workflow
From screenshot to trade plan in seconds
SnapPChart is designed for the decision point after you find a setup and before you enter it. Screenshot the chart, upload it, review the grade, then decide whether the risk is worth it.
- Upload a TradingView, Webull, Robinhood, MetaTrader, or broker screenshot
- Check candlestick structure, trend, indicators, volume, and key levels
- Check if a breakout is already too extended
- Grade a pullback into VWAP, EMA, or prior resistance
- Review the entry, stop, targets, and bear case before sizing
- Keep the same process across stocks, forex, crypto, futures, and ETFs
Screenshot workflow
Built for trading chart screenshots, not generic image captions.
Traders usually ask for the best AI to analyze candlestick chart screenshots or a TradingView screenshot. This is the page for that job: upload the chart image, get a structured trade review, then decide whether the setup is worth risking money on. For breakout setups, the AI breakout detection guide shows how volume, level quality, and context separate clean breaks from fakeouts. Trading gold? The XAUUSD chart analysis page grades the same screenshot with gold-specific session and level context. Reviewing a trade you already closed? The AI trade analyzer re-grades the setup off the same screenshot, win or lose.
Use the chart you already trust
Take a screenshot from TradingView, Webull, Robinhood, MetaTrader, ThinkOrSwim, Interactive Brokers, or any broker chart. SnapPChart reads the screenshot instead of asking you to rebuild the chart.
Check the visible technicals
The AI reviews candles, trend, volume, support and resistance, VWAP, moving averages, MACD, RSI, and pattern structure when those signals are visible in the image.
Turn the screenshot into a decision
You get the same output on every upload: setup grade, pattern read, entry zone, stop loss, targets, risk/reward, and the main reason to skip the trade.
Tool landscape
AI chart analysis tools solve different jobs.
If you are searching for the best AI for analyzing trading chart screenshots, separate the tools by workflow. SnapPChart is built for the last step before entry, grading the chart you are already considering.
Read the full AI chart analysis guideScreenshot graders
Best when you already found a setup and need the chart read back with a grade, entry, stop, targets, and risk notes.
Compare AI chart toolsScalp setup graders
Best when you're scalping 1-5 minute charts and need a grade, entry, stop, and targets before the next candle prints.
See scalp-specific gradingSwing setup graders
Best when you're holding for days and grading a daily or 4-hour chart: the trend structure, the pullback into a moving average, and target room before you size in.
See AI swing setup gradingMarket scanners
Best when you need candidates. They help find stocks in play, but you still need to decide whether the chart is worth trading.
See AI scanner workflowCharting platforms
Best for drawing, alerts, watchlists, and manual analysis. Pair them with a screenshot grader when you want a second opinion.
Compare charting workflowsCompare SnapPChart
How SnapPChart stacks up against the tools you already use
SnapPChart grades the chart you found. See where it fits next to the scanners, screeners, charting platforms, and general AI you might already pay for.
Head to head
SnapPChart vs a general AI chat assistant for chart screenshots
Most traders land here after pasting a chart into a general AI tool and getting a vague description. Here is how a purpose-built screenshot grader compares for the last decision before you risk money.
| Feature | SnapPChart | General AI chat assistant |
|---|---|---|
| Reads any chart screenshot | Every upload | Inconsistent |
| Setup grade (A+ to F) | Yes | No |
| Entry, stop, and targets | Every upload | Varies by prompt |
| Same criteria every time | Fixed methodology | Varies by prompt |
| Multi-target exit plan (T1 / T2) | Yes | Rarely consistent |
| Risk/reward + invalidation | Yes | Inconsistent |
| Speed to a decision | Seconds | Prompting required |
| Grade history to review | Yes | No |
Keep Learning the Setup
Use these guides to understand how SnapPChart grades the trade instead of taking the output blindly.
AI Chart Analysis FAQ
Everything you need to know about screenshot-based chart grading.
Which AI is best for analyzing stock charts in 2026?
For analyzing a stock chart screenshot in 2026, the best AI is one that returns a structured, repeatable trade review instead of a loose description: a setup grade, the pattern, support and resistance, an entry, a stop, targets, and the bear case. SnapPChart is built around that screenshot-to-trade-plan workflow and grades every chart on the same A-F criteria, so a strong setup and a weak one are judged the same way. General AI chat assistants can describe a chart, but they reply in prose that shifts between uploads, which makes the read hard to compare day to day. The honest limit on any of them: a screenshot tool scores the structure in the image, it does not see live price, news, or order flow.
What is the best AI for analyzing trading chart screenshots?
The best AI for trading chart screenshots is the one that gives a repeatable trade review, not a vague chart description. Look for a setup grade, pattern read, key levels, entry, stop loss, targets, risk/reward, and a clear bear case. SnapPChart is built around that screenshot-to-trade-plan workflow.
Can AI tell me whether to take a trade from a chart screenshot?
AI does not place the trade for you, but it gives you the structured read to make the call yourself. Upload the screenshot and SnapPChart returns a setup grade, an entry zone, a stop, targets, the risk/reward, and an explicit bear case. A high grade with clean risk/reward means the chart earned the trade; a low grade with thin reward means wait for a better one. You stay the decision-maker, the AI just makes sure you saw the case against the trade before you risked money on it.
Can AI analyze candlestick chart screenshots?
Yes. SnapPChart can analyze candlestick chart screenshots when the candles, timeframe, price scale, and indicators are visible. It reads the image for structure, momentum, support and resistance, volume, and common patterns like flags, breakouts, pullbacks, reversals, and weak retests.
Can I upload a TradingView screenshot for AI analysis?
Yes. Open the chart in TradingView, take a screenshot, and upload it to SnapPChart. You keep TradingView for charting, alerts, and live data, then use SnapPChart as the AI second opinion before you decide whether to take the setup.
Can AI really analyze stock and forex charts?
Yes. SnapPChart uses a multimodal vision model to interpret the chart image: candlesticks, support and resistance, indicator alignment, volume, trend, and visible risk/reward.
What charts can I upload?
You can upload stocks, forex pairs, crypto, futures, ETFs, and commodities from TradingView, ThinkOrSwim, Webull, Robinhood, MetaTrader, Interactive Brokers, or any charting app.
How accurate is the analysis?
SnapPChart gives a probabilistic setup grade, not a guarantee. The grade reflects how clearly the visible technical signals align and where the risk breaks down.
Is there a free trial?
Yes. New users get two lifetime chart analyses. Start from the upload section on the homepage; no credit card is required to try it.
Explore more AI chart analysis pages
Grade setups across more markets, platforms, and strategies with the same AI workflow.
Upload your next chart before you enter.
Get an AI setup grade, trade plan, and risk notes in seconds. No credit card required to start.
Grade a Chart Free