Free AI crypto analysis: grade the setup from a screenshot before you chase the move.
Upload a Bitcoin, Ethereum, or altcoin chart screenshot and get a setup grade, entry, stop loss, targets, and risk notes before trading a 24/7 market.
Drag and drop your chart screenshot
or click to browse. PNG, JPG, or WebP.
Your first analysis is free. No credit card.
Make sure both the time axis (X) and price axis (Y) are visible in your screenshot for accurate results.
Market
BTC/USD
Timeframe
15m
Read
Basing
Risk
Breakdown
Crypto readout
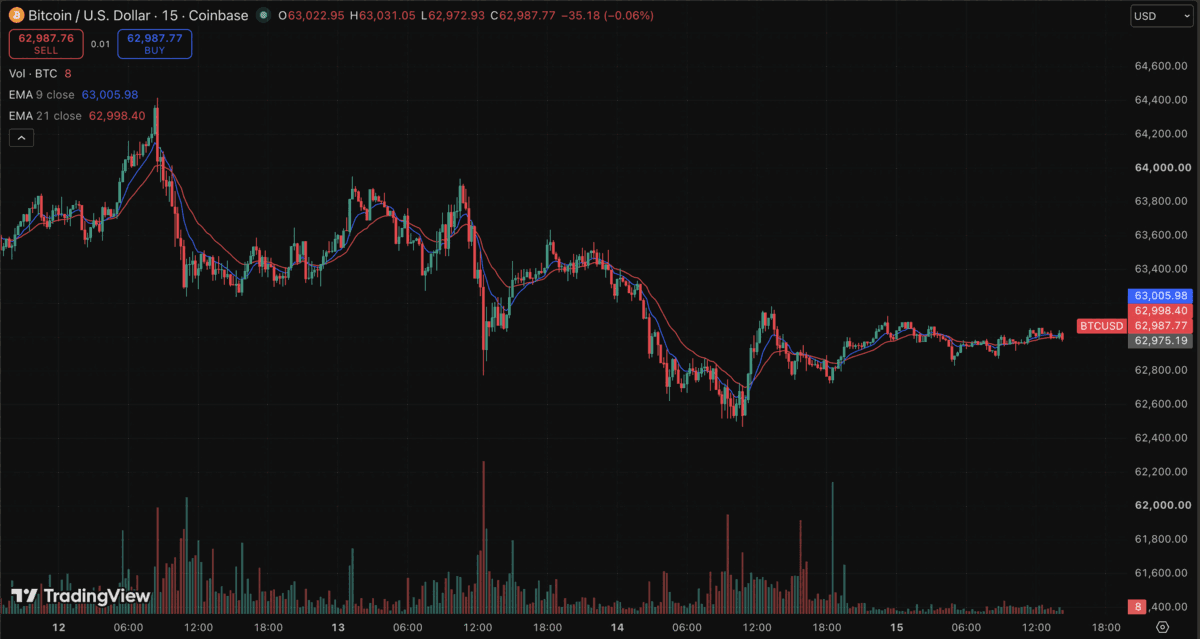
Crypto sample analysis: this BTC/USD 15-minute chart sold off from 64,400 into 62,500 and is now flattening against the 9 and 21 EMAs. SnapPChart reads whether that is a base worth buying or a knife still falling, then returns the entry, structural stop, targets, and the level that would invalidate the bounce.
BTC
Bitcoin trend, breakout, and dip setups
ETH
Ethereum pullbacks, continuations, and dip buys
SOL
High-beta altcoin momentum
LINK
Altcoin range breaks and retests
Quick answer
How does free AI crypto analysis work?
Free AI crypto analysis means uploading a Bitcoin, Ethereum, or altcoin chart image to a model that grades the setup before you trade. SnapPChart reads candles, trend, support and resistance, indicator alignment, volume, and risk/reward from the screenshot itself, then returns a setup grade, entry zone, structural stop, multi-target exits, and the main reasons the trade could fail.
The crypto chart screenshot analyzer works on charts from Coinbase, Binance, Bybit, Kraken, OKX, TradingView, or any exchange. Because crypto trades 24/7 with sudden volatility spikes, the bear case explicitly flags chase risk, over-extension, and thin-liquidity windows. When Bitcoin or Ethereum sells off hard, the grade shows whether the chart is a clean bounce off support or a falling knife that has not based yet. That lets you size the dip with a plan instead of a guess, and because the market never closes, the grade gives you a fixed checkpoint to come back to instead of reacting to every weekend candle.
What the AI Returns From a Screenshot
Use the output as a repeatable pre-trade checkpoint, not a prediction.
A-F Setup Grade
See whether the setup has enough pattern clarity, momentum, volume, and reward to justify the risk.
Entry, Stop, Targets
Get a structured trade plan with entry zone, invalidation level, targets, and risk/reward.
Screenshot-Based Read
Use charts from TradingView, Webull, ThinkOrSwim, MetaTrader, Robinhood, or any broker.
Risk Notes First
The analysis flags extension, messy chop, weak retests, thin reward, and conflicting indicators.
Screenshot workflows
Grade the crypto chart screenshot before the volatility decides for you
Crypto charts can look clean for one candle and messy five minutes later. SnapPChart gives you a consistent process before you size into the trade.
- Upload a Bitcoin breakout chart before taking the retest
- Grade an Ethereum pullback into VWAP, EMA, or prior resistance
- Check whether an altcoin momentum move is already too extended
- Use it as a crypto chart screenshot analyzer on Coinbase, Binance, Bybit, or Kraken charts
- Compare a spot crypto chart against the perpetual futures chart for the same pair
- Grade a Bitcoin or Ethereum dip before buying the selloff: clean bounce off support vs falling knife
- Re-grade after a weekend candle to see whether the structure is still clean
- Grade BTC, ETH, and one altcoin in the same sitting and take only the cleanest of the three
- Check a thin weekend or holiday session before sizing the same way you would on a weekday
- Screenshot a chart in your phone exchange app and grade it without redrawing it on desktop
- Grade a crypto chart screenshot someone posted before you copy the trade off it
Crypto headlines
Latest Bitcoin, ETH & altcoin news
Recent crypto stories tagged to the coins SnapPChart traders are analysing right now. Tap any headline to read the full article.
Bitcoin and ethereum prices today, Wednesday, September 16, 2026: Crypto prices tank after CLARITY Act fails and ahead of Fed decision
Bitcoin opened at $75,586.51 on Wednesday, September 16, 2026, 3.3% lower than Tuesday's opening price. As of 7:12 a.m. ET this morning, the price of bitcoin moved higher to $75,885.53.…
CLARITY Act Failure Triggers $300M Long Liquidation as Lummis Says Democrats 'Chose Politics Over the American People'
The Senate failed to advance the CLARITY Act in a 49-50 cloture vote. Crypto markets reacted sharply, with $300 million in leveraged long positions liquidated ...
Billionaire Mark Cuban Says This Asset Class Will Be the New Crypto. Here's Why He's Wrong.
The key to valuing Bitcoin is its inherent scarcity, which has led to outsize returns over the past 15 years.
Bitcoin and XRP Await the Fed After CLARITY Act's Failure: Another Blow Coming?
CLARITY Act fails in the Senate as Bitcoin (BTC) and XRP brace for the Fed decision. Here's what comes next.
Bitcoin ETFs Are Coming Off Their Best 3-Week Stretch of the Year. What's Next for Bitcoin?
ETF inflows have returned, but Bitcoin still faces an uphill battle to end the year above $100,000.
AEVEX Selected for Up to $92.2M SkyRange Contract Supporting Department of War Hypersonic Testing
SOLANA BEACH, Calif., September 16, 2026--AEVEX Corp. (NYSE: AVEX) announced it has been selected for a contract valued at up to $92.2 million over the next three years to support…
Head to head
What a graded crypto chart gives you that a chat prompt does not
Ask a chat assistant about the same BTC chart twice and you can get two different reads. Every crypto chart upload here returns the same structured fields, so a Bitcoin setup and an altcoin setup are scored on identical criteria.
| Feature | SnapPChart | General AI chat assistant |
|---|---|---|
| Reads crypto / BTC / ETH chart screenshots | Yes, every upload | Inconsistent |
| Setup grade (A+ to F) | Yes | No |
| Flags 24/7 extension and low-liquidity risk | Every bear case | Rarely surfaced |
| Entry, stop, targets for perps and spot | Yes | Varies by prompt |
| Same criteria across altcoins | Fixed methodology | Varies by session |
| Grade history to review | Yes | No |
Keep Learning the Setup
Use these guides to understand how SnapPChart grades the trade instead of taking the output blindly.
What do traders ask about Crypto Chart Analysis?
How SnapPChart grades Bitcoin, Ethereum, and altcoin charts.
Can AI analyze a Bitcoin or Ethereum chart screenshot?
Yes. Upload a chart from Coinbase, Binance, Bybit, Kraken, TradingView, or any crypto exchange. SnapPChart reads the candles, trend, support and resistance, indicators, and volume from the image and returns a setup grade, entry, stop loss, targets, and bear case.
Does the AI handle 24/7 crypto markets differently than stocks?
SnapPChart uses the same grading methodology on crypto as on stocks: structure, momentum, indicator alignment, volume, and risk/reward all feed the grade. What changes is the bear case, which explicitly flags the 24/7 nature of crypto. Gaps are rare, but extended weekend or low-liquidity sessions can produce setups that look clean on the chart and trade in thin order books.
Can SnapPChart grade altcoin charts, not just BTC and ETH?
Yes. SnapPChart grades altcoins like SOL, LINK, and AVAX the same way it grades BTC and ETH, and it works on any coin you can screenshot. The grading criteria do not change by coin, only the chart in front of it does, so the grade penalises an altcoin chart that is already too extended or that lacks volume confirmation on the move.
Does it work for crypto perpetual futures, not just spot?
Yes. Perpetual futures charts from exchanges like Bybit, Binance Futures, or OKX work the same as spot charts. SnapPChart reads what is on the chart, including funding-sensitive structure if visible, and returns the same structured trade plan.
How does the AI grade a Bitcoin breakout vs a retest?
SnapPChart grades a clean breakout with volume and structural support behind it higher than a retest that is already extended. The bear case flags whether the move is too parabolic to chase, and the alternative entry typically suggests waiting for a retest or pullback rather than entering at the high.
How do I run BTC chart AI analysis during a sell-off?
Upload a Bitcoin chart screenshot from any timeframe and SnapPChart grades it as it stands. During a sell-off the BTC chart AI analysis reads where price sits relative to prior support, whether volume confirms a real bounce or just panic, and whether momentum is turning or still falling. A dip into support with stabilising structure grades higher than one still breaking down, and the bear case names the level that would invalidate the bounce.
Can AI tell if an Ethereum dip is a buy or a falling knife?
Yes. Upload the Ethereum chart and SnapPChart grades whether the dip is basing at a level with confluence or still in free fall. A clean bounce off prior support with a reclaim grades as a tradeable setup with an entry, structural stop, and targets. A knife that has not based yet grades low, and the alternative entry usually suggests waiting for a reclaim or retest before sizing in.
Can the AI tell me if a crypto chart is too messy to trade?
Yes. SnapPChart pushes the grade toward C, D, or F when it reads chop, conflicting indicator signals, or unclear structure. Crypto grades top out at B, so a B on a crypto chart is the clean read rather than a consolation prize. The workflow is to skip anything grading C or below and look for the next setup instead of forcing a trade on a messy chart.
Which crypto chart should I grade first when everything is moving at once?
Grade every chart you would actually size into and let the scores rank them for you. SnapPChart scores every upload on the same criteria, so a Bitcoin chart and a mid-cap altcoin chart come back directly comparable, which is the point of grading several in one sitting rather than one at a time. When Bitcoin leads a move and the altcoins follow, the Bitcoin chart typically carries the cleaner structure while the altcoin charts carry more extension risk, and the bear case on each grade names which is which.
Does a weekend crypto chart grade differently from a weekday one?
No. SnapPChart's grading methodology stays the same on weekends, but what the chart shows often does not. Weekend and holiday sessions trade in thinner order books, so a breakout can look clean on the candles while resting on very little volume. The grade reads the volume that is actually visible, and the bear case flags thin-liquidity conditions and moves that are likely to be retraced when desks come back. Re-grading the same pair once weekday volume returns is the cheapest way to see whether the structure survived.
Does the AI work on Coinbase, Binance, Bybit, or Kraken screenshots?
Yes. SnapPChart reads the chart image, not the exchange. Whether the screenshot comes from Coinbase Advanced, Binance, Bybit, OKX, Kraken Pro, or a TradingView chart for the same pair, SnapPChart uses what is visible on the chart: candles, indicators, volume, trend, and key levels. Use whichever exchange you actually trade from, and the altcoin chart analyzer output stays consistent across them.
How do I analyze a crypto chart screenshot with AI?
Take a screenshot of the chart you are already looking at and drop it into SnapPChart. There is nothing to connect and no API key to paste, because the crypto chart screenshot analyzer works off the image itself, so whatever your exchange or charting app renders is what gets graded. You get a letter grade for the setup, an entry zone, a structural stop, multi-target exits, and the bear case that would invalidate it. Crypto grades cap at B, so a B is the clean read rather than a consolation prize.
Can I screenshot a crypto chart on my phone and grade it?
Yes, and that is how most crypto charts get graded, because the market does not wait for you to get back to a desk. Screenshot the chart in whichever exchange or charting app you already have open, then upload it from the same phone. The read uses whatever the screenshot shows, so a mobile chart carrying fewer indicators still grades fine as long as the candles and key levels are legible. Crop out the order panel if it covers price.
Is there a free trial for crypto traders?
Yes. New users get 2 lifetime chart analyses to test SnapPChart on a real BTC, ETH, or altcoin setup, with no credit card required. The first analysis is full depth; the second is gated to show what the paid product adds. After those two free reads, paid plans start at $4.99 per week.
Upload your crypto chart free.
Get an AI trade grade, entry, stop, targets, and risk notes for BTC, ETH, or any altcoin chart.
Analyze a Crypto Chart Free