Grade your BTC chart before you chase the next candle.
Upload a Bitcoin chart screenshot and get a setup grade, entry, stop loss, targets, and risk notes built for a market that never closes.
Drag and drop your chart screenshot
or click to browse. PNG, JPG, or WebP.
Your first analysis is free. No credit card.
Make sure both the time axis (X) and price axis (Y) are visible in your screenshot for accurate results.
Market
BTC/USD
Focus
Bitcoin
Read
Structure
Risk
Chase risk
Bitcoin readout
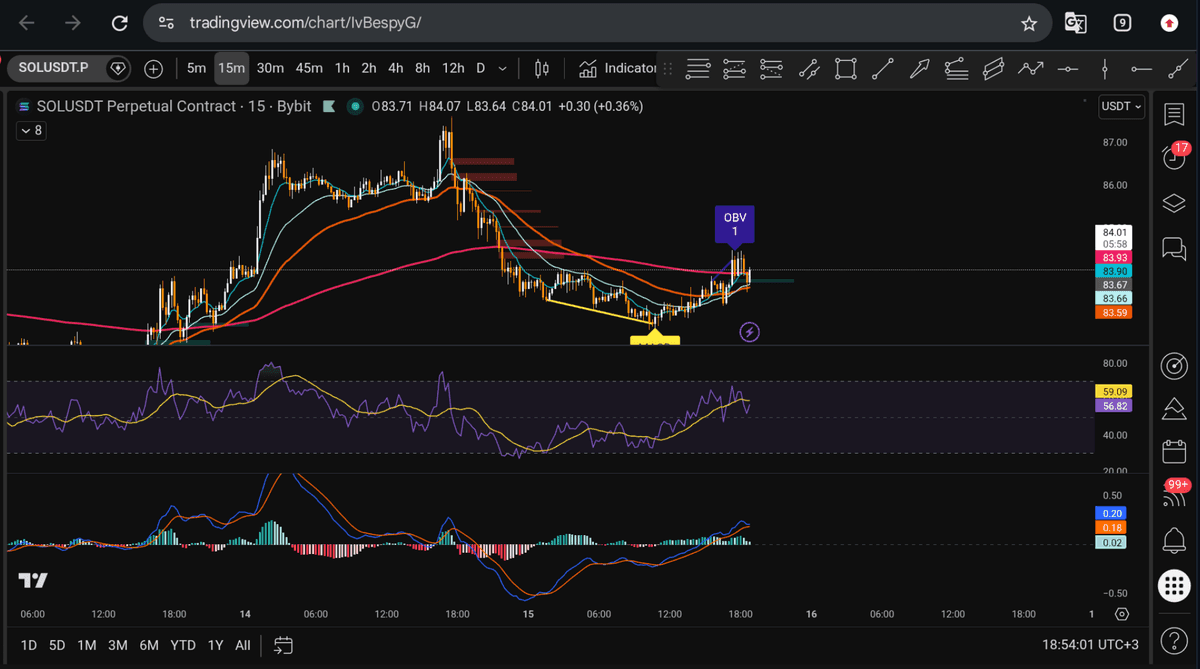
BTC sample analysis: trend structure, dip-buy quality against prior support, chase risk on extended candles, and whether the setup still has room to target are checked from the chart itself.
BTC/USD
Spot Bitcoin against the US dollar
BTCUSDT
Bitcoin paired against Tether on exchanges
BTC PERP
Bitcoin perpetual futures charts
IBIT / GBTC
Spot Bitcoin ETF charts
Quick answer
Can AI analyze a Bitcoin chart?
Yes. Upload a BTC chart screenshot from Coinbase, Binance, Bybit, Kraken, TradingView, or any exchange, and SnapPChart reads the candles, trend, support and resistance, volume, and indicators directly from the image, then returns a setup grade, entry, stop loss, targets, and the bear case. Bitcoin's price scale has swung from four-figure lows to six-figure highs across past cycles, so the read adapts to whatever scale is visible on your screenshot instead of assuming a fixed range. Because BTC trades 24/7 with no session close, a clean-looking breakout can turn into a low-liquidity air pocket a few candles later, so the bear case explicitly flags chase risk and thin order books. The grade reflects the screenshot at the moment you upload it, not a live feed, so re-run it after a weekend or holiday candle before trusting an older read.
What the AI Returns From a Screenshot
Use the output as a repeatable pre-trade checkpoint, not a prediction.
A-F Setup Grade
See whether the setup has enough pattern clarity, momentum, volume, and reward to justify the risk.
Entry, Stop, Targets
Get a structured trade plan with entry zone, invalidation level, targets, and risk/reward.
Screenshot-Based Read
Use charts from TradingView, Webull, ThinkOrSwim, MetaTrader, Robinhood, or any broker.
Risk Notes First
The analysis flags extension, messy chop, weak retests, thin reward, and conflicting indicators.
When to use it
Grade Bitcoin before the next candle talks you into it
Bitcoin does not close, so there is no daily bell to reset your head before the next session. SnapPChart gives you a fixed checkpoint before you size into a breakout, a dip, or a retest.
- Check a Bitcoin breakout before chasing the retest
- Grade a BTC dip into prior support: clean bounce vs falling knife
- Compare a spot BTC/USD chart against BTC perpetual futures
- Re-grade after a weekend or holiday candle before trusting an old read
- Filter out thin, low-volume BTC moves before committing size
Bitcoin headlines
Latest Bitcoin (BTC) news
Recent BTC stories from Yahoo Finance and Google News. Use the news read alongside your chart grade before sizing into a position.
What Will 10,000 XRP Be Worth in 2030?
Standard Chartered and Ripple's own CTO Emeritus name very different 2030 prices for XRP, and the gap between those targets represents hundreds of thousands of dollars on a single stack…
Analysts Think Bitcoin is Less Than $5,000 Away From a Bull Market
Bitcoin sits $4,900 below a bull market confirmation as whales sell the rally and US funds stay out. Everything you need to know.
A $93 trillion trading boom puts CME in an unusual spot
Bank of America sees an unusual win-win setup for CME
IPO Delayed: Sam Altman Says an OpenAI Going Public in 2026 Would Be ‘Ill-Advised’
Sam Altman just pumped the brakes on what was shaping up as one of the largest IPOs in market history, and his reasons go far beyond typical market timing concerns.
Jordi Visser Puts Bitcoin In The Same Bucket As SpaceX, Anthropic And OpenAI, Says ‘None Of Them Make Money’
Jordi Visser grouped Bitcoin, SpaceX, Anthropic, and OpenAI as future-defining assets that do not rely on profits.
$100,000 in These 3 Income ETFs Generates About $350 Every Week
Weekly-paying ETFs promise a paycheck every seven days, but the hidden trade-offs buried inside some of these funds can quietly erode the very wealth they appear to be building. Three…
Head to head
SnapPChart vs a general AI chat assistant for Bitcoin chart analysis
General AI tools can describe a BTC chart, but they will not return the same structured fields twice and will not flag 24/7 chase risk on their own. SnapPChart grades every Bitcoin setup, spot or futures, to the same standard so you can compare a breakout, a dip buy, and a retest on equal footing.
| Feature | SnapPChart | General AI chat assistant |
|---|---|---|
| Reads BTC spot, futures, and ETF chart screenshots | Yes, every upload | Inconsistent |
| Flags 24/7 chase risk and thin-liquidity windows | Every bear case | Rarely surfaced |
| Adapts to Bitcoin's shifting price scale | Reads the visible scale | May assume a fixed range |
| Setup grade (A+ to F) | Yes | No |
| Dip-buy vs falling-knife read | Every bear case | Inconsistent |
| Same methodology on every BTC upload | Fixed | Varies by prompt |
| Grade history to review | Yes | No |
Keep Learning the Setup
Use these guides to understand how SnapPChart grades the trade instead of taking the output blindly.
What do traders ask about BTC Chart Analysis?
How SnapPChart reads Bitcoin chart screenshots.
Can AI grade a Bitcoin (BTC) chart screenshot?
Yes. Upload a BTC chart screenshot from Coinbase, Binance, Bybit, Kraken, TradingView, or any exchange, and SnapPChart returns a setup grade, entry, stop loss, targets, and a bear case. The AI reads the candles, structure, key levels, and volume from the image itself, the same way a trader would eyeball the chart.
Does SnapPChart use live Bitcoin price feeds or on-chain data?
No. The grade is built entirely from what is visible in the screenshot you upload: candles, indicators, volume, and price levels. SnapPChart does not pull a live BTC price feed, does not read on-chain data such as exchange flows, wallet activity, or funding rates, and does not check the dollar index, news, or an economic calendar. If a level or indicator is not on the chart, it is not part of the grade.
How does the AI handle Bitcoin's 24/7, no-close market?
The grading criteria stay the same: structure, momentum, volume, and risk/reward. Because Bitcoin never closes, the bear case explicitly flags chase risk on candles that already ran, and calls out when a chart shows a weekend or holiday session, since volume and liquidity typically thin out outside normal trading hours even though the market stays open.
How does the grade account for Bitcoin's volatility and price scale?
Bitcoin can move thousands of dollars in a single session, and its price scale has shifted by an order of magnitude across past cycles. SnapPChart does not use a fixed price assumption. It reads whatever scale, timeframe, and tick size are visible on your screenshot, and the bear case flags when a move looks extended relative to its own recent range rather than a hardcoded number.
Can AI tell if a Bitcoin dip is a buy or a falling knife?
The AI grades what the chart shows: whether the dip is basing at a level with confluence and starting to reclaim it, or still breaking down with no structure. A stabilizing bounce off prior support grades higher than one still falling, and the bear case names the level that would invalidate the read. It is a structure read on the screenshot, not a prediction of where BTC goes next.
Does it work for BTC futures and spot ETFs, not just spot BTC/USD?
Yes. Spot BTC/USD, BTCUSDT pairs, perpetual and CME BTC futures, and spot Bitcoin ETF charts like IBIT or GBTC all work. SnapPChart reads the chart image, not the instrument type, so the analysis adapts to whatever price scale and timeframe is visible.
Can I compare a spot Bitcoin chart to the futures chart for the same setup?
You can upload both charts as separate analyses and compare the grades. A setup that grades clean on both spot and futures is a stronger confluence signal than one that only looks clean on a single chart.
Why re-grade a Bitcoin chart after a weekend candle?
Bitcoin trades through the weekend while most other markets are closed, so a weekend candle can build or break structure with far fewer participants watching. The grade only reflects the screenshot at the moment you upload it, so a setup that looked clean Friday can look different by Monday. Re-upload the current chart rather than trusting an old grade.
Is there a free trial to test the Bitcoin grader?
Yes. New users get 2 lifetime chart analyses to test the grader on a real BTC setup, no credit card required. The first analysis is full depth; the second is gated so you can see what the paid product adds.
Upload your Bitcoin chart free.
Get a BTC setup grade, trade plan, and risk notes in seconds.
Analyze a Bitcoin Chart Free