AI candlestick pattern recognition that grades the trade, not just the candle.
Upload a candlestick chart screenshot and SnapPChart reads the pattern (engulfing, hammer, doji, flag, breakout), then grades whether the setup is actually worth trading, with an entry, stop, targets, and the bear case.
Drag and drop your chart screenshot
or click to browse. PNG, JPG, or WebP.
Your first analysis is free. No credit card.
Make sure both the time axis (X) and price axis (Y) are visible in your screenshot for accurate results.
Pattern
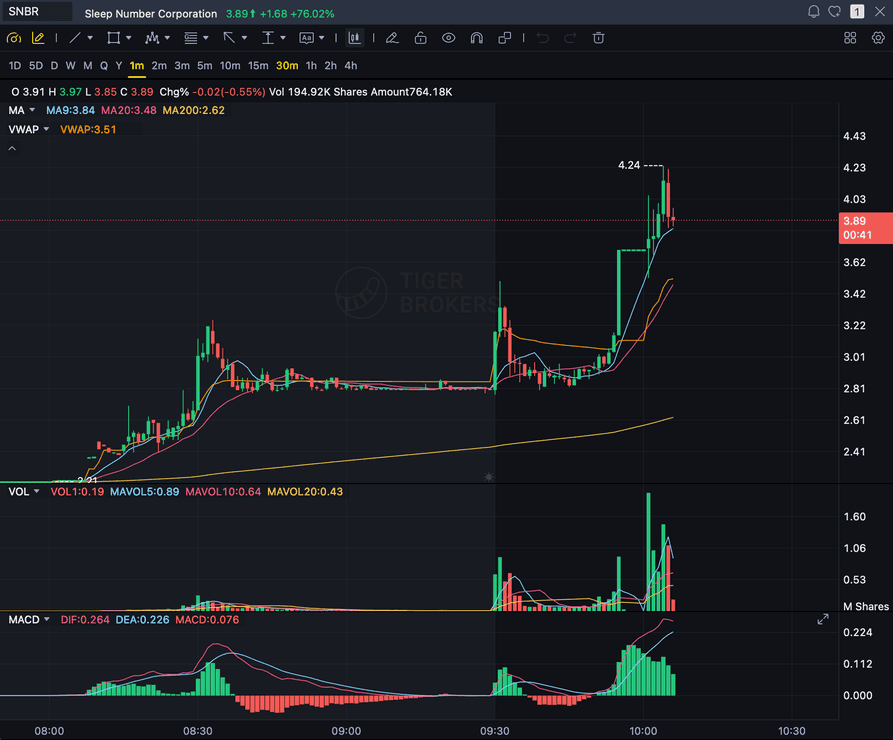
Bull flag
Grade
B+
Entry
$3.87
Stop
$3.75
Candlestick readout
Sample readout: SnapPChart names the candlestick pattern, then checks whether volume and structure actually back it before grading the setup and returning an entry, a structural stop, and targets.
REVERSAL
Hammer, engulfing, doji, morning and evening star
CONTINUATION
Flags, pennants, inside bars, three soldiers
BREAKOUT
Range breaks, base breakouts, and clean retests
EXHAUSTION
Shooting star, gravestone, and blow-off candles
Quick answer
What is AI candlestick pattern recognition?
AI candlestick pattern recognition is software that reads a chart screenshot and identifies the candlestick patterns on it: bullish and bearish engulfing, hammer, shooting star, doji, morning and evening star, flags, inside bars, and breakouts. Most pattern tools stop there: they label the candle and leave you to decide what it means. SnapPChart goes one step further, which is the step that actually matters. After it recognizes the pattern, it grades whether the setup is worth trading: it checks the trend, volume, support and resistance, and risk/reward behind the candle, then returns an A+ to F grade, an entry zone, a structural stop, targets, and the main reasons the pattern could fail. A textbook hammer at the wrong level on thin volume is not a trade, and the grade says so. The best AI for analyzing candlestick chart screenshots is the one that tells you whether the pattern earned the trade, using the same criteria every time so your own bias does not get to upgrade a weak candle into an A setup.
What the AI returns from a candlestick chart
Pattern recognition is step one. The grade and trade plan are why you actually upload the chart.
Pattern Identified
Names the candlestick pattern it reads from the screenshot: engulfing, hammer, doji, flag, breakout, and more.
A-F Setup Grade
Grades whether the pattern has the trend, volume, and structure to be worth trading, not just a textbook shape.
Entry, Stop, Targets
Turns the pattern into a structured trade plan with an entry zone, an invalidation level, and realistic targets.
Bear Case First
Flags failed patterns, weak volume, and chop so a clean-looking candle does not talk you into a bad trade.
Workflow
From candlestick pattern to graded trade plan
Spotting the pattern is the easy part. The question that costs you money is whether this hammer or engulfing candle is actually worth trading. SnapPChart grades that in seconds.
- Screenshot the chart showing the candlestick pattern you spotted
- Let the AI confirm the pattern: engulfing, hammer, doji, flag, breakout
- Check whether volume and structure actually back the candle
- Read the grade before you trust a textbook pattern shape
- Take the A and B+ patterns, skip the C-grade fakeouts
- Use the same read on stock, forex, crypto, and futures candles
Head to head
SnapPChart vs a candlestick pattern scanner
Most candlestick pattern tools stop at naming the candle: hammer, engulfing, doji. That is the easy part. The hard part is knowing whether this particular pattern is actually worth trading. Here is how a setup grader compares for the decision right before you risk money.
| Feature | SnapPChart | A pattern-recognition scanner |
|---|---|---|
| Names the candle (hammer, engulfing, doji) | Yes | Yes |
| Grades if the pattern is worth trading | A+ to F | Just labels it |
| Checks volume and structure behind the candle | Every grade | Shape only |
| Entry, stop, and targets from the pattern | Yes | No |
| Flags failed / low-quality patterns | Every bear case | Rarely |
| Reads any chart screenshot, any platform | Every upload | Needs a data feed |
| Same criteria on every pattern | Fixed methodology | Varies |
| Grade history to review | Yes | No |
Keep learning candlestick patterns
Short reads on how AI reads candlestick patterns and why a clean pattern still needs a grade before you trade it.
AI Candlestick Pattern Recognition FAQ
How SnapPChart reads candlestick patterns from a screenshot and grades the setup.
Can AI recognize candlestick patterns from a screenshot?
Yes. SnapPChart uses a multimodal vision model to read candlestick patterns directly from a chart image (engulfing, hammer, shooting star, doji, morning and evening star, flags, inside bars, and breakouts) as long as the candles, timeframe, and price scale are visible. It does not need a data feed, an API key, or broker integration; it reads the picture the same way you do.
What is the best AI for analyzing candlestick chart screenshots?
The best AI for candlestick chart screenshots is the one that grades the setup, not just the one that names the pattern. Look for a tool that recognizes the candle, then returns a setup grade, an entry, a stop, targets, risk/reward, and a clear bear case. SnapPChart is built around that recognize-then-grade workflow, and it applies the same criteria to every chart so a strong pattern and a weak one are judged on the same checklist.
Does naming the candlestick pattern mean it is a good trade?
No, and this is the core problem with pattern-only tools. A hammer at the wrong level, an engulfing candle on thin volume, or a breakout into resistance are textbook patterns that still fail. SnapPChart grades whether the trend, volume, structure, and risk/reward behind the candle actually support the trade, then flags the reasons it could fail in the bear case before you size in.
Which candlestick patterns can the AI read?
When they are visible on the chart, SnapPChart reads reversal patterns (hammer, inverted hammer, bullish and bearish engulfing, doji, morning and evening star, shooting star, gravestone), continuation patterns (flags, pennants, inside bars, three white soldiers), and breakout structure (range breaks, base breakouts, and retests). It folds the pattern into the overall setup grade rather than treating the candle in isolation.
Can I upload a TradingView candlestick chart for analysis?
Yes. Open the chart in TradingView, Webull, Robinhood, MetaTrader, ThinkOrSwim, or any broker, take a screenshot showing the candles and your indicators, and upload it. SnapPChart reads the candlestick patterns and visible indicators from the image and returns the grade and trade plan.
Does the AI work on stock, forex, and crypto candles?
Yes. Candlestick pattern recognition works the same across stocks, forex pairs, crypto, futures, and ETFs because the AI reads the chart image, not the symbol. The asset class is inferred from the chart and the trade plan adapts to it.
How accurate is AI candlestick pattern recognition?
The pattern read is reliable when the candles are clearly visible, but recognition is not the same as a guarantee. SnapPChart returns a probabilistic setup grade: A and B+ reflect a pattern with strong confluence behind it, while C, D, and F reflect a pattern that is weak, conflicting, or already extended. Use the grade as a pre-trade gate, not a prediction.
Is there a free trial?
Yes. New users get two lifetime chart analyses, no credit card required. The first analysis shows the full depth; the second is gated so you can see exactly what the paid product adds. Start from the upload section on the homepage.
Explore more AI chart analysis pages
Grade setups across more markets, platforms, and strategies with the same AI workflow.
Grade the candlestick pattern before you trade it.
Upload the chart from the homepage and get the pattern, a setup grade, and a trade plan in seconds. No credit card required.
Grade a Candlestick Chart Free