Grade your breakout setup before you take it.
Breakout trading means trading price clearing a key level: a resistance, a range high, or a consolidation top, where the thesis is that the move continues after the break. You find the breakout yourself by reading your own charts. Upload the chart screenshot and SnapPChart reads the structure, the level being broken, the trend, the base before the break, and the volume, then returns a setup grade, entry, stop, targets, and the bear case.
LEVEL
The key level, range high, or resistance being broken
VOLUME
Volume expansion confirming the break, not a thin push
STRUCTURE
Base or consolidation before the break, and retest behavior
TREND
Trend and context the break is happening inside of
Grade
B+
Entry
$3.87
Stop
$3.75
Target
$4.24
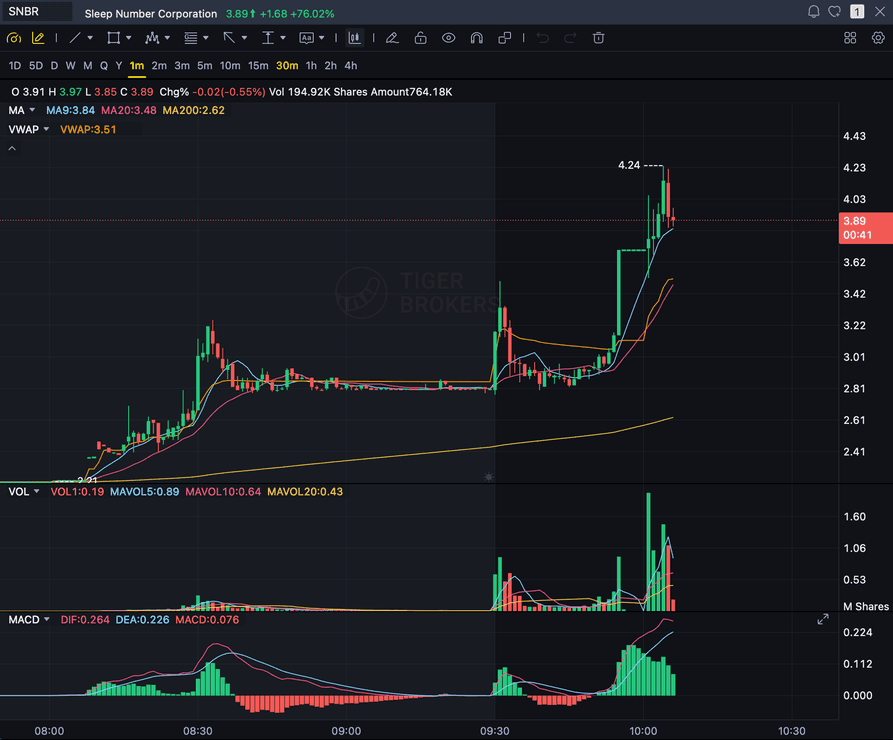
Sample readout
SNBR 1m bull flag pullback: strong opening momentum, lighter-volume consolidation, and a late breakout attempt with the 3.89 price marker near the current candle.
Quick answer
What is AI breakout trading analysis?
AI breakout trading analysis means using a chart-reading model to grade a breakout setup before you enter it, instead of chasing a level break on feel. Breakout trading is a thesis: price is clearing a key level, a resistance, a range high, or a consolidation top, and you take the trade because the move looks like it continues after the break. You bring the breakout, you found it yourself by reading your own charts, and SnapPChart grades whether the chart earned the trade. SnapPChart does not scan the market for breakouts and does not detect breakouts for you. It reads the screenshot you upload directly, the market structure, the level being broken, the trend and key levels, the base or consolidation before the break, and the visible volume, then returns a setup grade from A+ to F, an entry zone, a structural stop, multi-target exits, and the main reasons the trade could fail. It applies the same criteria to every chart, so a clean break on expanding volume and a thin, low-volume break get judged on the same checklist instead of on how exciting the break looks. Breakout is about the thesis, not the clock: the scalp trading AI page tunes for 1-5 minute charts, and the day trading AI page is the broad intraday umbrella; this page grades the breakout setup specifically, whatever timeframe you trade it on.
What the AI Returns From a Screenshot
Use the output as a repeatable pre-trade checkpoint, not a prediction.
A-F Setup Grade
See whether the setup has enough pattern clarity, momentum, volume, and reward to justify the risk.
Entry, Stop, Targets
Get a structured trade plan with entry zone, invalidation level, targets, and risk/reward.
Screenshot-Based Read
Use charts from TradingView, Webull, ThinkOrSwim, MetaTrader, Robinhood, or any broker.
Risk Notes First
The analysis flags extension, messy chop, weak retests, thin reward, and conflicting indicators.
Workflow
Use it as a pre-entry filter on the breakouts you find
Breakouts move fast, and a chase into a thin, low-volume break that fails still costs real money. You find the breakout by reading your own charts; SnapPChart gives you a quick, consistent quality gate before you commit to the trade.
- Grade a breakout entry before you take it
- Check whether volume actually expands behind the break or fades into it
- Confirm the base or consolidation before the break is clean enough to trust
- Re-grade the same name after a retest of the broken level to see if the setup got cleaner
- Compare two breakout setups on the same checklist before you pick one
- Skip C-grade breakouts where the level is weak or the reward is not there
Head to head
SnapPChart vs a general AI chat assistant for chart screenshots
Most traders land here after pasting a chart into a general AI tool and getting a vague description. Here is how a purpose-built screenshot grader compares for the last decision before you risk money.
| Feature | SnapPChart | General AI chat assistant |
|---|---|---|
| Reads any chart screenshot | Every upload | Inconsistent |
| Setup grade (A+ to F) | Yes | No |
| Entry, stop, and targets | Every upload | Varies by prompt |
| Same criteria every time | Fixed methodology | Varies by prompt |
| Multi-target exit plan (T1 / T2) | Yes | Rarely consistent |
| Risk/reward + invalidation | Yes | Inconsistent |
| Speed to a decision | Seconds | Prompting required |
| Grade history to review | Yes | No |
Keep Learning the Setup
Use these guides to understand how SnapPChart grades the trade instead of taking the output blindly.
AI Breakout Trading FAQ
How SnapPChart grades a breakout-trading setup from a screenshot.
What does AI for breakout trading actually do?
It grades the breakout setup you are about to take. Upload the chart screenshot of the breakout you found and SnapPChart reads the structure, the level being broken, the trend and key levels, the base before the break, and the volume, then returns a setup grade from A+ to F, an entry zone, a structural stop, multi-target exits, and the bear case. It is built for the moment right before you click buy on a break, so you can see whether the chart earned the trade instead of chasing because the level just cracked.
Does it scan for breakouts or build a watchlist?
No. You find the breakout yourself by reading your own charts, then upload the chart here to grade the setup before you enter. SnapPChart does not scan the market for breakouts, does not detect breakouts for you, and does not build a watchlist. You bring the breakout, the AI grades whether the chart earned the trade.
Does the AI read live data or detect breakouts for me?
No. SnapPChart reads the breakout chart screenshot you upload, not a live data feed. It does not detect breakouts, does not scan the market for tickers, does not pull the economic calendar, and does not predict the next candle. It also does not build a watchlist and does not read relative volume or float for you. It grades the structure, the level being broken, the trend and key levels, the base before the break, and the volume that are visible in the image, then returns the trade plan and the bear case. You find the breakout; the AI tells you whether it earned the risk.
How is this different from the scalp and day trading pages?
Breakout trading is a thesis, not a timeframe: you take the trade because price clearing a key level looks like the move continues. The scalp trading AI page tunes the read for the 1-5 minute charts where setups disappear in seconds. The day trading AI page is the broad intraday umbrella, any trade you open and close inside the session. This page grades the breakout-thesis setup specifically, whatever timeframe you trade it on.
What makes a breakout setup grade well?
A clean break of a well-defined level, a tight base or consolidation before the break, and volume that expands behind the move all support a stronger grade. If the level is weak, the base is sloppy, the volume is thin, or price is already extended past the break, the grade reflects that and the bear case flags the failed-break risk before you size in.
Does it work on long setups only?
Yes. This page is built for long breakout setups, so SnapPChart is optimized for the buy side. Short setups, options, and hedging strategies are out of scope by design. The one-strategy-mastered approach is to grade the long breakout setups it understands well rather than spreading thin across everything.
Is there a free trial for breakout traders?
Yes. New users get two lifetime chart analyses to try the grading workflow on real breakouts. The first analysis shows the full depth so you can see exactly what it returns; the second is gated to show what the paid product adds. No credit card required.
Grade the breakout setup before you click buy.
Find the breakout by reading your own charts, upload the chart from the homepage, and get a quick, structured read on the setup. No credit card required.
Grade a Breakout Chart Free