An AI trade analyzer for the setup you are about to take.
A trade analyzer for the chart itself, before you enter. Screenshot the trade you are looking at, upload it, and the AI grades the setup, makes one call (take it, wait for a pullback, or skip it), and lays out the entry, stop, targets, and the reasoning. Works on stock, futures, forex, and crypto charts, from your phone or desktop.
Drag and drop your chart screenshot
or click to browse. PNG, JPG, or WebP.
Your first analysis is free. No credit card.
Make sure both the time axis (X) and price axis (Y) are visible in your screenshot for accurate results.
Grade
B+
Entry
$3.87
Stop
$3.75
Target
$4.24
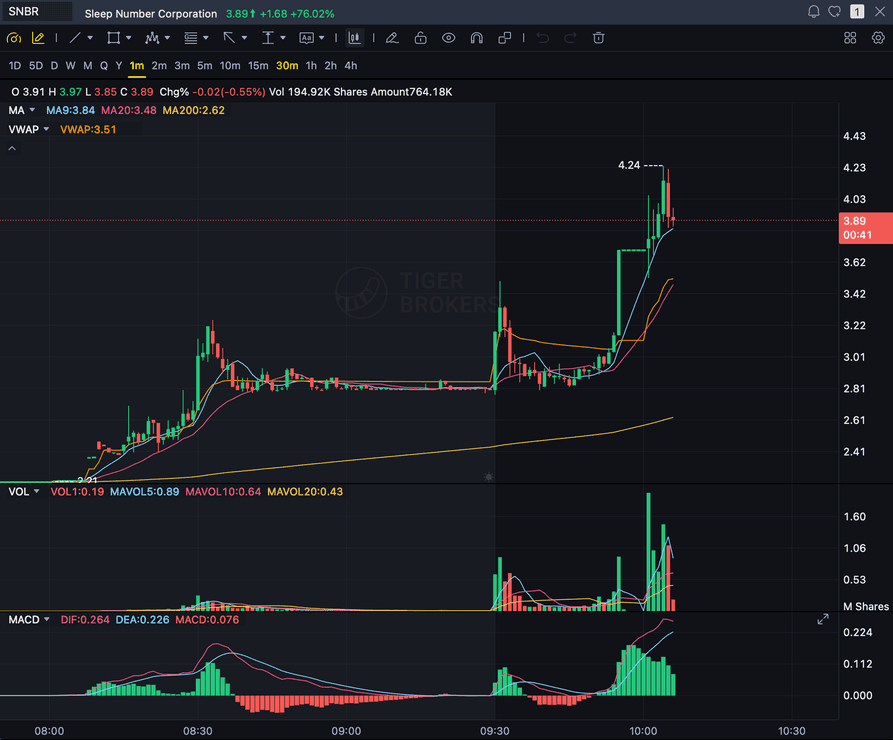
Sample trade review (stock chart)
SNBR 1-minute bull flag pullback: strong opening momentum, a lighter-volume consolidation, and a late breakout attempt near 3.89. The analyzer returns the grade, entry, stop, and target shown above, plus the case against the trade, before you size in.
SETUP
Grade the specific trade you are about to take
RISK
Entry, stop, targets, and reward-to-risk
BIAS
The bear case against your own trade idea
ANY CHART
Stocks, forex, crypto, and futures screenshots
Quick answer
What does a trade AI analyzer do before you enter?
A trade AI analyzer reviews the stock, forex, crypto, or futures chart you are about to trade and returns the same repeatable read every time: structure, indicator alignment, volume, risk/reward, entry zone, stop placement, and multi-target exits. SnapPChart grades the setup, long or short, and shows the bear case before you size in.
It is built for that pre-entry moment rather than for scanning the market or finding new tickers. Traders look for the same tool under a stack of names: an AI trade analyzer, a trading analyzer, trade analyzer AI, AI analyzer trading, or an AI analyzer for trading. It reads the screenshot you upload and nothing else, so the grade reflects the chart in front of you rather than a live data feed or a news headline. It is a trade analyzer for financial market charts, not a fantasy sports trade evaluator: the trade here is a position in a stock, currency pair, coin, or futures contract. Used right before you click buy, it is the difference between taking a setup because the chart earned it and taking it because you are bored or already talked yourself into it.
Before you upload
What a trade analyzer means here
People use "trade analyzer" for a lot of different tools. This is exactly what this one does, so the first result is what you expected.
You upload
A screenshot of the chart
The chart of a trade or setup you are looking at, from TradingView, your broker app, or any charting platform. Keep the price axis and the timeframe in the frame. That image is the only input: no account link, no typing in prices.
You get back
A grade, one call, and the plan
A setup grade and one call: take the trade, wait for a pullback, or skip it. When there is a trade, you also get the entry, a structural stop, targets, the risk/reward, why the stop sits where it does, and the case against the trade.
Expect skips
It says no to weak charts
A messy or extended chart gets a low grade and a skip, with the reason spelled out. That is the useful part: the edge is mostly in the setups you pass on, and the same criteria apply to every chart you upload.
It is not
A P&L import, a journal, or a signal feed
It does not connect to your broker, import your fills, or work out your P&L, and it does not send trade alerts. If you want to review closed trades in a journal, that is a different tool. This one grades the chart before you enter.
Charts and devices
Stock charts, futures charts, and the app question
The four things people check before trying it, answered straight.
Stocks
A trade analyzer for stock charts
Screenshot any stock or ETF chart from Webull, Robinhood, thinkorswim, TradingView, or your broker, on anything from a 1-minute to a daily chart. Stocks get the full A+ to F scale, and the entry, stop, and targets come back as prices.
Futures
Works on NQ, ES, and other futures charts
Upload an NQ, ES, or any other futures screenshot and you get the same read: structure, key levels, entry, stop, and targets. Futures, like every non-stock chart, are graded on a scale that tops out at B, so a B on an NQ chart is the best mark it gives.
App
Is there a trade analyzer app?
There is no App Store or Play Store download. SnapPChart runs in the browser on your phone and your desktop, so you can screenshot a chart in your broker app and upload it from the same phone. Add it to your home screen if you want it one tap away.
Predictor
Is it an AI trade predictor?
No. It does not forecast where price goes next. It grades how clean the setup in your screenshot is and shows where the trade is wrong (the stop) and where it pays (the targets). Whether price gets there is still up to the market.
What the AI trade analyzer returns
The same structured trade review on every chart, so one setup is comparable to the next.
Grades the Trade You Are Taking
Not a generic chart description. The AI trade analyzer grades the specific setup you are about to enter, A+ to F.
Entry, Stop, Targets, R:R
A full trade plan: entry zone, structural stop, multi-target exits, and the reward measured against the risk.
Catches Confirmation Bias
Every analysis returns the bear case and invalidation, so you confront why the trade could fail before you size it.
Reads the Screenshot Directly
No prompting, no broker integration. Upload the chart and the analyzer reads candles, indicators, volume, and levels.
Workflow
Use it right before the entry decision
This trading AI analyzer is not a scanner. It is for the moment when you already have a trade idea and need a clean, unemotional read before you click buy.
- Check whether your trade idea is supported by the visible chart
- Compare the entry against the stop and realistic targets
- Catch mixed signals before confirmation bias takes over
- Use it as an AI analyzer for trading whether the chart is stocks, forex, crypto, or futures
- Force yourself to read the bear case before sizing the position
- Review the same fields on every setup so your process stays consistent
Head to head
An AI trade analyzer vs a market scanner
Scanners answer a different question. They surface tickers to look at; an AI trade analyzer grades the one trade you are about to take. Most traders need both, but only one of them tells you whether this setup earned the risk.
| Feature | SnapPChart | A market scanner |
|---|---|---|
| Analyzes the specific trade you are about to take | Yes | Finds tickers instead |
| Setup grade (A+ to F) | Yes | No |
| Entry, stop, targets, and risk/reward | Every analysis | Watchlist only |
| Reads your chart screenshot directly | Every upload | Needs a live data feed |
| Forces the bear case before you size | Every analysis | Not its job |
| Same fields on every trade | Fixed methodology | Varies by filter |
| Works on stocks, forex, crypto, futures | Any screenshot | Depends on the scanner |
| Grade history to review | Yes | No |
Keep Learning the Setup
If your trade idea starts with a chart screenshot, use the primary AI chart analysis workflow and compare the broader tool landscape.
What do traders ask about AI Trading Analyzer?
How SnapPChart reviews trade setups from chart screenshots.
Is there an AI that grades my trade setup before I enter?
Yes. SnapPChart is an AI that grades the trade setup you are about to take. Upload the chart screenshot and it returns a letter grade from A+ to F, an entry zone, a stop, multi-target exits, the risk/reward, and the bear case in seconds, using the same criteria on every chart. It is built for the moment right before you click buy, so you can see whether the setup earned the trade instead of talking yourself into it. New users get two free grades, no card required.
What does an AI trade analyzer actually do?
An AI trade analyzer reviews the chart you are about to trade and turns the setup into a repeatable checklist: technical structure, indicator alignment, volume, risk/reward, entry plan, stop placement, and targets. SnapPChart is built specifically for that pre-entry decision moment, not for finding tickers or running scans.
Is a trade AI analyzer the same as an AI trade analyzer?
Yes. Trade AI analyzer, AI trade analyzer, AI trading analyzer, trade analyzer AI, AI analyzer trading, and AI analyzer for trading all describe the same workflow: upload the chart of the trade you are considering and get a structured, repeatable review before you enter. SnapPChart returns a setup grade, an entry, a stop, targets, risk/reward, and the bear case on every upload, using the same criteria each time so your decisions stay comparable across trades.
Is this different from a market scanner like Trade Ideas or Finviz?
Yes. Scanners help you find candidates. SnapPChart grades the chart you already have in front of you. The two are complementary. Use the scanner to surface symbols, then upload the chart screenshot here for the pre-trade quality check.
How is this better than asking a general AI chatbot to look at my chart?
A general AI can describe a chart, but the format and depth change every prompt. SnapPChart returns the same structured fields every time (grade, thesis, entry, stop, targets, bear case), so the trader's decisions are comparable across setups instead of one-off readings.
Can the AI catch confirmation bias in my own trade idea?
That is one of the core jobs of the analyzer. By returning a fixed set of fields including the bear case and invalidation conditions, SnapPChart forces you to confront the reasons the trade could fail before you size it. The grade does not move because you want the trade to work.
What does the analyzer return for a high-grade vs low-grade setup?
A high-grade setup returns a clean trade plan: a specific entry, a structural stop, multi-target exits, and a confident thesis. A low-grade setup returns the same fields, plus a more explicit bear case and the recommendation to skip the trade and wait for a cleaner chart.
What markets and timeframes does the trade analyzer grade?
Stocks, ETFs, forex pairs, crypto, futures, and indices, from any charting platform that lets you take a screenshot. The asset class is inferred from the chart, and the output adapts to it: forex targets come back pip-aware, and stock levels come back in price. Timeframes run from 1-minute and 5-minute scalp charts through 15-minute and hourly day-trade charts to daily and weekly swing charts. The analyzer reads the timeframe from the label on the chart, so keep the symbol and timeframe badge visible in the frame. A chart with the label cropped out still gets graded, but the read has to guess at the holding period, which makes the stop and target distances less useful.
Does it grade short setups as well as long ones?
Yes. The grade follows the structure on the chart, not a built-in bullish bias, and shorts are graded the same way longs are: as continuation trades. A rally into resistance or a falling moving average inside an established downtrend that rolls over into a lower high comes back as a short setup, with the stop above the invalidation level, targets underneath, and a bear case that flips to list what would make the trade fail to the upside. What it does not grade as a short is a chart in an uptrend that has just topped, because counter-trend reversals are outside the method in both directions. If there is no continuation read either way, it says so and recommends skipping the chart rather than forcing a side.
What does the trade analyzer not do?
It does not pull live prices, connect to a broker, or place orders. It reads the screenshot you upload, so a level that moved after you took the screenshot is not in the read. It does not scan the market for tickers, read news or earnings, or know your account size unless you enter it in the position-size calculator. It is also not a fantasy sports trade analyzer. And it is not financial advice: it is a structured second read on a chart, and the decision to take the trade stays with you.
Can the AI analyze a trading screenshot end to end?
Yes. Upload the screenshot directly: the AI trading screenshot analyzer reads candles, indicators, volume, trend, key levels, and pattern structure from the image itself. It does not need broker integration, an API key, or a live data feed. The trade setup is reviewed using only what is visible on the chart, which is what most discretionary traders are deciding from anyway. That is also why an AI trading screenshot workflow tends to be more honest than asking a general AI tool to describe the chart in prose.
Is there a free trial for the analyzer?
Yes. New users get 2 lifetime chart analyses to test the analyzer on real trade ideas, with no credit card required. The first analysis is full depth; the second is gated to show exactly what the paid product adds.
Does it give me a scorecard for my setups?
Yes, for the setup itself: a letter grade, a total numeric score, and a confluence count, the same criteria applied to every chart, so one setup's grade is comparable to the next. What it does not track is whether you followed your own rules after you entered, moved your stop, or held past a target. That is a trade-execution or discipline scorecard, a different job than grading the chart in front of you before you take the trade.
Analyze the trade before you take it.
Screenshot the chart, drop it in the upload box at the top of this page, and get the grade, the plan, and the case against the trade in seconds. Your first two analyses are free, no card needed.
Grade My Chart Free