Drop in a chart screenshot, get a graded trade plan back.
SnapPChart is a chart screenshot analyzer. Upload a screenshot of any stock, forex, crypto, or futures chart and the AI reads the candles, levels, and visible indicators, then returns a setup grade, entry, stop, targets, and risk notes. No redrawing, no prompting.
Drag and drop your chart screenshot
or click to browse. PNG, JPG, or WebP.
Your first analysis is free. No credit card.
Make sure both the time axis (X) and price axis (Y) are visible in your screenshot for accurate results.
Grade
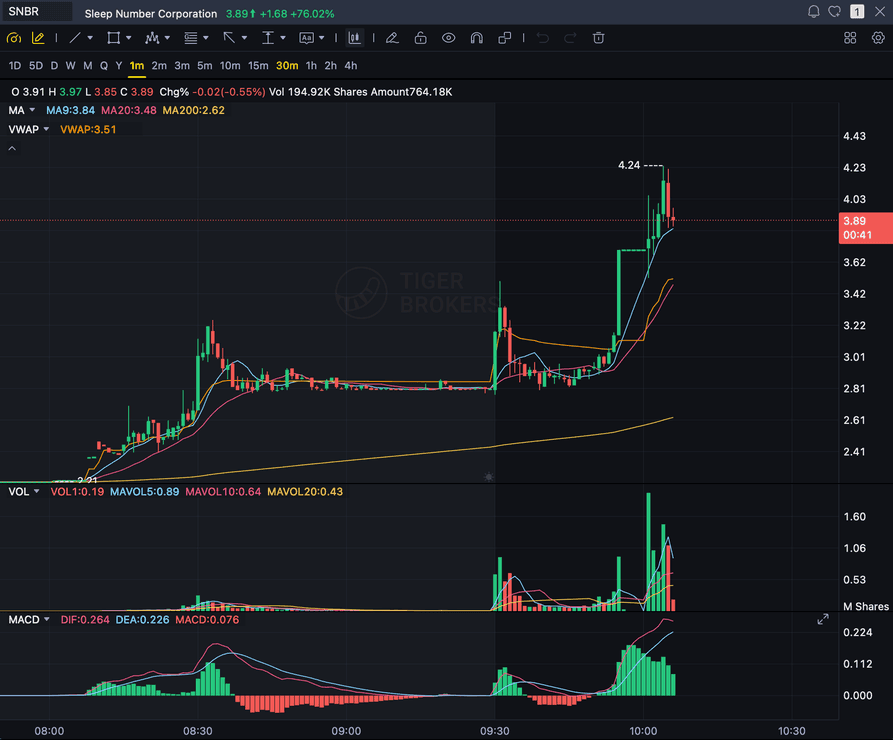
B+
Entry
$3.87
Stop
$3.75
Target
$4.24
Sample readout
SNBR 1m bull flag pullback: strong opening momentum, lighter-volume consolidation, and a late breakout attempt with the 3.89 price marker near the current candle.
STOCKS
Momentum, breakout, pullback, and reversal setups
FOREX
Major pairs, crosses, XAUUSD, and session context
CRYPTO
Bitcoin, Ethereum, and high-beta altcoin charts
FUTURES
Index, commodity, and intraday futures screenshots
Quick answer
What is a chart screenshot analyzer?
A chart screenshot analyzer is a tool that reads a picture of a trading chart and returns a structured trade review instead of a vague description. SnapPChart looks at the screenshot the same way you do, reading candles, trend, support and resistance, volume, and any indicators that are visible, then grades the setup A+ to F with an entry, a stop, targets, and the main reason it could fail. You use it right after you spot a setup in TradingView or your broker and want a fast, consistent read before you risk money. The analyzer applies the same criteria to every screenshot, so a strong setup and a weak one get judged on the same checklist instead of on how you feel about the trade.
What the AI Returns From a Screenshot
Use the output as a repeatable pre-trade checkpoint, not a prediction.
A-F Setup Grade
See whether the setup has enough pattern clarity, momentum, volume, and reward to justify the risk.
Entry, Stop, Targets
Get a structured trade plan with entry zone, invalidation level, targets, and risk/reward.
Screenshot-Based Read
Use charts from TradingView, Webull, ThinkOrSwim, MetaTrader, Robinhood, or any broker.
Risk Notes First
The analysis flags extension, messy chop, weak retests, thin reward, and conflicting indicators.
Workflow
From screenshot to graded setup in one upload
You do not rebuild the chart or describe it in words. Screenshot it, drop it in, and read the grade.
- Screenshot the chart from TradingView, Webull, Robinhood, MetaTrader, or any broker
- Upload the image, with no redrawing or prompting needed
- The analyzer reads candles, levels, volume, and visible indicators
- Read the A+ to F grade, entry, stop, targets, and bear case
- Take the A and B+ setups, skip the rest, and screenshot the next chart
Head to head
SnapPChart vs a general AI chat assistant for chart screenshots
Most traders land here after pasting a chart into a general AI tool and getting a vague description. Here is how a purpose-built screenshot grader compares for the last decision before you risk money.
| Feature | SnapPChart | General AI chat assistant |
|---|---|---|
| Reads any chart screenshot | Every upload | Inconsistent |
| Setup grade (A+ to F) | Yes | No |
| Entry, stop, and targets | Every upload | Varies by prompt |
| Same criteria every time | Fixed methodology | Varies by prompt |
| Multi-target exit plan (T1 / T2) | Yes | Rarely consistent |
| Risk/reward + invalidation | Yes | Inconsistent |
| Speed to a decision | Seconds | Prompting required |
| Grade history to review | Yes | No |
Keep Learning the Setup
Use these guides to understand how SnapPChart grades the trade instead of taking the output blindly.
Chart Screenshot Analyzer FAQ
How the analyzer reads a chart image and what it returns.
How does a chart screenshot analyzer work?
It uses a multimodal vision model to read the chart image directly. SnapPChart interprets the candles, trend, support and resistance, moving averages, VWAP, MACD, RSI, and volume that are visible in the screenshot, then returns a setup grade, entry, stop, targets, and a bear case. You do not type out what the chart shows; the analyzer reads the picture.
What does the analyzer return from one screenshot?
Every upload returns the same fields: an A+ to F setup grade, the likely pattern, an entry zone, a structural stop loss, multi-target exits (T1 partial and T2 full), risk/reward, and the main reason the trade could fail. Same structure every time so you can compare one screenshot to the next.
Can I analyze a screenshot of a candlestick chart?
Yes. As long as the candles, timeframe, and price scale are visible, the analyzer reads candlestick structure and common patterns like flags, breakouts, pullbacks, reversals, doji, hammer, and engulfing, then folds that into the grade.
Does it work with a TradingView or broker screenshot?
Yes. Screenshot any chart from TradingView, Webull, Robinhood, MetaTrader, ThinkOrSwim, Interactive Brokers, or any charting app and drop it in. The analyzer is platform-agnostic because it reads the image, not a data feed.
Is the chart screenshot analyzer free to try?
Yes. New users get 2 lifetime chart analyses, no credit card required. The first analysis shows the full depth so you can see exactly what the analyzer returns; the second is gated to show what the paid product adds.
Does the analyzer place trades or predict prices?
No. It is a pre-trade decision layer, not an autonomous trader and not a price predictor. It grades the setup in front of you so your process stays repeatable. You stay the decision-maker.
Explore more AI chart analysis pages
Grade setups across more markets, platforms, and strategies with the same AI workflow.
Analyze your next chart screenshot.
Upload a screenshot from the homepage and get a graded trade plan in seconds. No credit card required.
Analyze a Screenshot Free