AI technical analysis on the indicators already on your chart.
SnapPChart is an AI technical analysis tool that reads the EMAs, VWAP, MACD, volume, market structure, and key levels on your chart screenshot, then returns a setup grade, entry, stop, targets, and the bear case.
Drag and drop your chart screenshot
or click to browse. PNG, JPG, or WebP.
Your first analysis is free. No credit card.
Make sure both the time axis (X) and price axis (Y) are visible in your screenshot for accurate results.
VWAP
Below
MACD
Crossed
Structure
Basing
Levels
Supply
Technical read
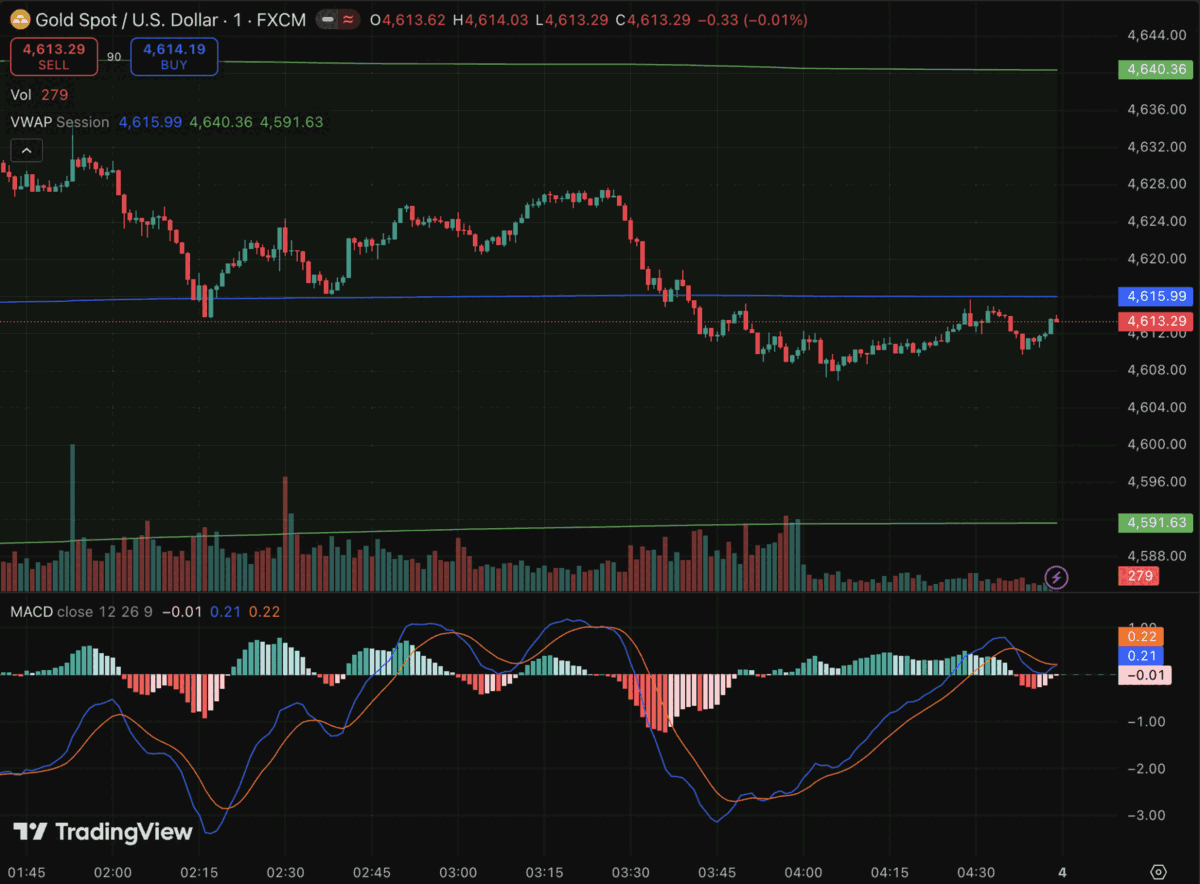
Sample technical read: price sells off from 4,628 through session VWAP at 4,615.99 and bottoms at 4,608 on expanding red volume. It has based between 4,608 and 4,616 since, and the last push tagged VWAP without closing above it. The close at 4,613.29 is still below VWAP, and the MACD has crossed back under its signal line at 0.21 against 0.22. Concern: the base has not produced a VWAP reclaim, so a long here buys into the supply that drove the breakdown.
INDICATORS
EMAs, VWAP, MACD, and volume read off the chart
STRUCTURE
Higher highs and lower lows called out explicitly
LEVELS
Support and resistance mapped against entry and stop
ANY CHART
Stocks, forex, crypto, and futures screenshots
Quick answer
What is AI technical analysis?
AI technical analysis is software that applies a fixed technical read to a chart image instead of doing it by eye. SnapPChart reads the moving averages, VWAP, MACD, volume, market structure, and support and resistance visible on your screenshot, then returns a setup grade, an entry zone, a stop, targets, and the reward against the risk.
The point is repeatability. Doing technical analysis manually, the same chart reads differently depending on whether you are up or down on the day, and the checklist quietly shortens when you already want the trade. Automated technical analysis applies the same criteria to every chart, so a B on Monday means what a B meant on Friday. SnapPChart reads only what is drawn on the screenshot you upload, with no broker link, no API key, and no live data feed, which is the same information a discretionary trader is deciding from anyway. It is the analysis step, not a scanner and not a signal service: you bring the chart, it does the read.
What the AI technical analysis returns
The same technical fields on every chart, so one read is comparable to the next.
Reads the Indicators on Your Chart
EMAs and how far price has run from them, session VWAP, MACD momentum, and volume against its recent behaviour.
Calls the Market Structure
Higher highs and higher lows, or lower highs and lower lows, stated explicitly instead of left to interpretation.
Maps Support and Resistance
Key levels, including round numbers, marked against your entry and stop so the risk is measured, not guessed.
Same Criteria Every Chart
The technical checklist does not shorten because you already like the setup. A B today means what a B meant last week.
Workflow
Where automated technical analysis actually helps
Technical analysis is a checklist most traders run inconsistently under pressure. Handing the read to a fixed process is how it stays the same on trade forty as it was on trade four.
- Get the indicator read without talking yourself into the trade first
- Check whether EMAs, VWAP, MACD, and volume actually agree with each other
- See the market structure called out as higher highs or lower lows, not vibes
- Have support and resistance marked against your entry and stop
- Run the same technical checklist on stocks, forex, crypto, and futures charts
- Compare today's read against your grade history instead of your memory
Head to head
AI technical analysis vs doing it manually
Manual technical analysis is not wrong, it is just inconsistent. The checklist quietly shortens on a setup you already want, and it shortens most on the trades where that costs the most. The comparison worth making is repeatability, not accuracy.
| Feature | SnapPChart | Reading it by hand |
|---|---|---|
| Same criteria on every chart | Fixed methodology | Varies with mood and fatigue |
| Indicator read (EMA, VWAP, MACD, volume) | Every upload | If you remember to check |
| Market structure stated explicitly | Yes | Usually implicit |
| Bear case before you size in | Every analysis | Skipped under pressure |
| Time to a full read | Seconds | Minutes per chart |
| Written record to review later | Every analysis stored | Only if you journal it |
| Context outside the chart (news, earnings) | Not visible in a screenshot | You already know it |
| Judgement on an unusual chart | Fixed criteria only | Experience wins here |
Keep Learning the Setup
For the mechanism behind the read, and how the wider tool landscape compares, start here.
What do traders ask about AI technical analysis?
How SnapPChart applies a technical read to an uploaded chart screenshot.
Can AI do technical analysis on a chart?
Yes. Upload a chart screenshot and SnapPChart reads the technicals directly off the image: the moving averages and how far price has run from them, VWAP, MACD and whether it is strengthening or rolling over, volume behaviour, market structure, support and resistance, and the candlestick pattern at the current level. It returns a setup grade from A+ to F, an entry zone, a stop, targets, and the reward against the risk.
Which indicators does the AI technical analysis read?
The read is built around the indicators most intraday and swing traders actually decide from: exponential moving averages and price's distance from them, session VWAP, MACD including whether momentum is building or weakening, and volume against its recent behaviour. Alongside those it reads market structure (higher highs and higher lows, or lower highs and lower lows), support and resistance including round-number levels, and the candlestick pattern printing at the current level. It reads what is drawn on your screenshot, so an indicator you did not put on the chart is not part of the read.
Is automated technical analysis better than doing it manually?
It is more consistent, which is a different claim. A human reading charts all session gets tired, anchors on the last trade, and shortens the checklist on a setup they already like. Automated technical analysis runs the same criteria every time, so your grades stay comparable across trades and across weeks. It does not replace judgement about context the chart cannot show, such as an earnings date or a news catalyst.
Does AI technical analysis predict where price is going?
No, and any tool claiming otherwise is selling something. Technical analysis describes what has already printed and what it implies about risk. SnapPChart grades whether the setup in front of you is worth the risk and where the stop belongs if it is. The next candle has not printed, so nothing here forecasts it.
Is this a technical analysis scanner or a signal service?
Neither. A scanner finds tickers and a signal service tells you what to buy. SnapPChart does the analysis step in between: you bring the chart you are already looking at, and it returns the structured technical read on that specific chart. Many traders use a scanner to surface candidates, then run the technical analysis here before deciding.
Does it work on forex, crypto, and futures charts, not just stocks?
Yes. Any chart screenshot from any platform is in scope, including stocks, forex pairs with pip-aware targets, crypto, futures, and ETFs. The asset class is inferred from the chart and the technical read adapts, so forex gets session and round-number context while a stock chart gets whole and half-dollar levels.
Do I need to connect a broker or an API for the analysis?
No. There is no account link, no API key, and no live data feed. The analysis reads the image you upload and nothing else. That is a real limit worth stating plainly: it cannot see anything outside the frame you screenshotted, including news, the earnings calendar, or price action after the capture.
How is this different from asking a general AI to read my chart?
A general AI can describe a chart, but the depth and the format change with every prompt, so two reads of the same setup are not comparable. SnapPChart returns the same technical fields in the same order every time, which is what makes a grade history worth reviewing. Consistency is the product.
Who is AI technical analysis for?
Discretionary stock, forex, crypto, and futures traders who already read charts and screenshot their setups from TradingView, Webull, MetaTrader, or a broker platform. It suits anyone who wants the same technical checklist applied to every setup before entering. It is not a beginner course that explains what an EMA is, and it is not a bot that trades for you.
Is there free AI technical analysis?
Yes. New users get two free lifetime analyses with no credit card. The first is full depth so you can see the complete technical read, entry, stop, and targets; the second is gated to show what the paid product adds. Paid plans start at $4.99 a week, with monthly and yearly options, and every paid tier returns the same analysis depth as that first free read.
Can I use the technical read to review trades afterwards?
Yes. Every analysis is stored, so you can look back at what the technical read said before you entered and compare it against how the trade actually resolved. Reviewing the grade you took against the outcome is the part most traders skip, and it is the part that changes behaviour.
Run the technical analysis before you take the trade.
Upload the chart and get the indicator read, market structure, levels, and a graded plan in seconds.
Run Technical Analysis Free