Grade your SOL chart before you chase the next candle.
Upload a Solana chart screenshot and get a setup grade, entry, stop loss, targets, and risk notes built for a market that moves on fast, narrative-driven volatility and its own capital-rotation cycles apart from Bitcoin and Ethereum.
Drag and drop your chart screenshot
or click to browse. PNG, JPG, or WebP.
Your first analysis is free. No credit card.
Make sure both the time axis (X) and price axis (Y) are visible in your screenshot for accurate results.
Market
SOL/USD
Focus
Solana
Read
Structure
Risk
Narrative spike
Solana readout
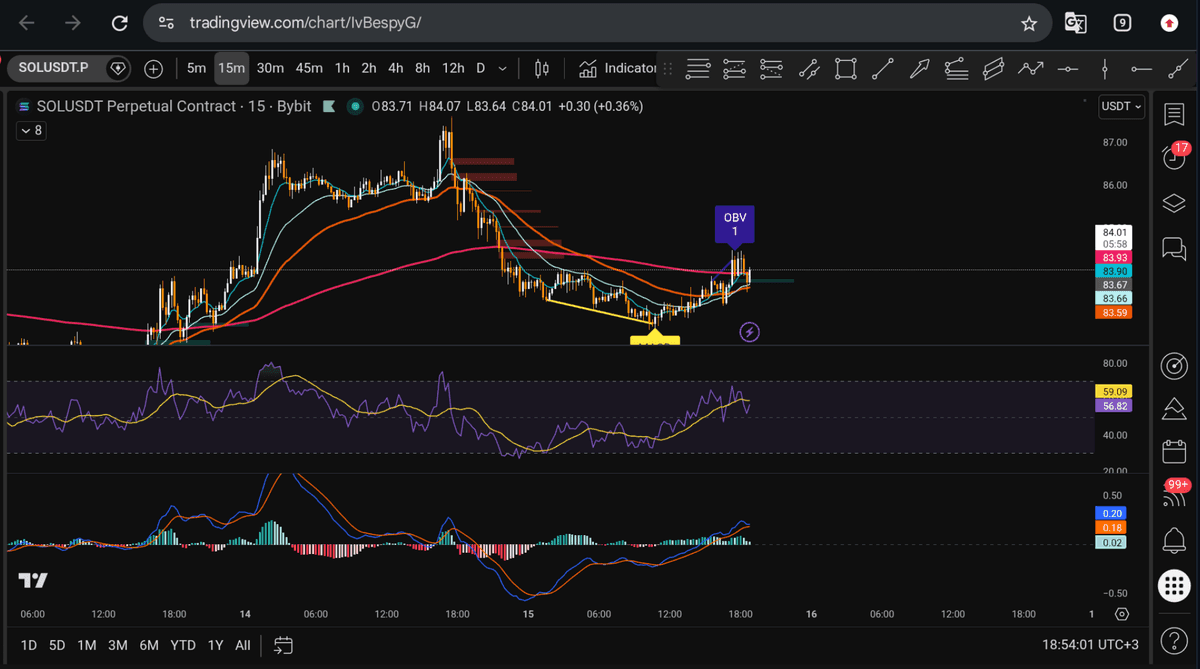
SOL sample analysis: trend structure, dip-buy quality against prior support, narrative-driven extension risk on a pumping candle, and whether the setup still has room to target are checked from the chart itself.
SOL/USD
Spot Solana against the US dollar
SOLUSDT
Solana paired against Tether on exchanges
SOL PERP
Solana perpetual futures charts
BSOL / GSOL
Spot Solana staking ETF charts
Quick answer
Can AI analyze a Solana chart?
Yes. Upload a SOL chart screenshot from Coinbase, Binance, Kraken, TradingView, or any exchange, and SnapPChart reads the candles, trend, support and resistance, volume, and indicators directly from the image, then returns a setup grade, entry, stop loss, targets, and the bear case. Solana's own trading culture skews faster and more narrative-driven than Bitcoin or Ethereum: low fees and high throughput make it the default chain for pump.fun-style meme coin launches, so SOL itself often sees sharp, narrative-fast volatility spikes when a hot new token or ecosystem story pulls capital in or out. Solana also has a well-documented history of network outages and validator downtime in past years, so an extended breakout deserves a gut check against that reliability history before you trust it, something the grade cannot see for you since it only reads the screenshot in front of it. Because SOL trades 24/7 with no session close, a clean-looking breakout can turn into a low-liquidity air pocket a few candles later, so the bear case explicitly flags chase risk. The grade reflects the screenshot at the moment you upload it, not a live feed, on-chain data, or a staking-yield check, so re-run it after a weekend or holiday candle before trusting an older read.
What the AI Returns From a Screenshot
Use the output as a repeatable pre-trade checkpoint, not a prediction.
A-F Setup Grade
See whether the setup has enough pattern clarity, momentum, volume, and reward to justify the risk.
Entry, Stop, Targets
Get a structured trade plan with entry zone, invalidation level, targets, and risk/reward.
Screenshot-Based Read
Use charts from TradingView, Webull, ThinkOrSwim, MetaTrader, Robinhood, or any broker.
Risk Notes First
The analysis flags extension, messy chop, weak retests, thin reward, and conflicting indicators.
When to use it
Grade Solana before the narrative gets ahead of the chart
Solana's fast throughput and meme-coin launch culture can turn a clean setup into a narrative-driven spike in minutes. SnapPChart gives you a fixed checkpoint before you size into the move.
- Check whether a SOL breakout still has room before chasing a pump.fun-driven spike
- Grade a Solana pullback into VWAP, EMA, or prior support before adding size
- Cross-check the SOL/USD spot chart against SOL perpetual futures for the same move
- Weigh an extended SOL rally against the network's own outage history before trusting it
- Grade a SOL chart during an alt-season rotation to see whether Solana is leading or lagging BTC and ETH
Solana headlines
Latest Solana (SOL) news
Recent SOL stories from Yahoo Finance and Google News. Use the news read alongside your chart grade before sizing into a position.
Solana Rose 10% and Bitcoin 5%: Is the Rotation Into Altcoins Starting?
Solana surged more than double Bitcoin's gains in a single session, sparking talk of a major capital shift into altcoins. But the real story behind the moves points to something…
Fairshake Has $193 Million for the Midterms. Which Coin Stands to Gain the Most on November 3?
Fairshake is sitting on $193 million to shape the midterms, but one crypto donor contributed for reasons far more personal than the others, betting the entire future of its business…
A Zcash ETF Launched in August Now Accounts for a Third of All Crypto ETF Trading
A Zcash ETF that barely existed a month ago now commands a startling share of all crypto ETF trading, and the reason why tells you something unsettling about how that…
Solana ETFs Experience 12 Consecutive Weeks of Inflows, While Bitcoin Has Its Quietest Week on Record
Solana ETFs held their ground through a Fed rate hike and a failed Senate crypto bill, while Bitcoin funds swung nearly $1.5 billion in a single week just to end…
XRP ETFs Have Been Frozen at $1.71 Billion. When Will Inflows Reach $2 Billion?
XRP ETFs have stalled well short of a key milestone, and three straight weeks of slowing inflows raise a pointed question: was August the peak, or can something still shake…
After a Long Hiatus, Crypto ETFs Are Making a Comeback. Here's the 1 Crypto ETF You Need to Own.
Money is flowing back into crypto ETFs, but which one is the best fit for your portfolio?
Head to head
SnapPChart vs a general AI chat assistant for Solana chart analysis
General AI tools can describe a SOL chart, but they will not return the same structured fields twice and will not flag pump.fun-style narrative volatility or Solana's own network-reliability history on their own. SnapPChart grades every Solana setup, spot or futures, to the same standard so you can compare a breakout, a dip buy, and a retest on equal footing.
| Feature | SnapPChart | General AI chat assistant |
|---|---|---|
| Reads SOL spot, futures, and ETF chart screenshots | Yes, every upload | Inconsistent |
| Flags pump.fun-style narrative volatility spikes | Every bear case | Rarely surfaced |
| Names Solana's own capital-rotation narrative instead of assuming a BTC echo | Grades the chart shown | May assume SOL mirrors BTC |
| Setup grade (A+ to F) | Yes | No |
| Distinguishes a healthy high-beta pullback from a real breakdown | Every bear case | Rarely specific |
| Monitors live Solana network status or validator uptime | No, chart structure only | No, also chart-only |
| Grade history to review | Yes | No |
Keep Learning the Setup
Use these guides to understand how SnapPChart grades the trade instead of taking the output blindly.
What do traders ask about SOL Chart Analysis?
How SnapPChart reads Solana chart screenshots.
Can AI grade a Solana (SOL) chart screenshot?
Yes. Upload a SOL chart screenshot from Coinbase, Binance, Kraken, TradingView, or any exchange, and SnapPChart returns a setup grade, entry, stop loss, targets, and a bear case. The AI reads the candles, structure, key levels, and volume from the image itself, the same read whether the chart is spot SOL, a perpetual future, or a Solana ETF chart.
Does SnapPChart use live Solana price feeds, staking yield, or on-chain data?
No. The grade is built entirely from what is visible in the screenshot you upload: candles, indicators, volume, and price levels. SnapPChart does not pull a live SOL price feed, does not read on-chain data such as validator activity, transaction throughput, or wallet flows, and does not calculate or verify staking yield even on a chart from a staking-enabled Solana ETF. It also does not monitor Solana's network status in real time. If a level or indicator is not on the chart, it is not part of the grade.
Does the AI factor in Solana's history of network outages or validator downtime?
No, and this is worth being explicit about. SnapPChart cannot see live network status, so it has no way to know if Solana is degraded, congested, or fully operational at the moment you upload a chart. Solana has a well-documented history of outages and validator downtime in past years, and that history is something you should weigh yourself before trusting an extended breakout, not something the grade checks for you. Treat the AI's read as a structure check on the chart, not a network-health check.
How does SnapPChart handle Solana's meme-coin and pump.fun-driven volatility?
Solana's low fees and high throughput make it the default chain for pump.fun-style meme coin launches, and that activity spills over into SOL's own price action: a hot new token or ecosystem narrative can pull a sharp, fast volatility spike into the SOL chart itself, distinct from Bitcoin's steady 24/7 chase risk or Ethereum's slower DeFi and layer-2 narrative shifts. The bear case flags when a SOL move looks like it is riding a narrative spike rather than a structurally supported breakout, so a chart pumping on hype grades differently than one breaking out on its own volume and structure.
Does the grade account for 'Solana season' or SOL's correlation to Bitcoin and Ethereum?
SnapPChart grades the chart you upload, not a cross-asset model. Solana's DeFi activity, NFT marketplaces, and meme-coin launches give it its own capital-rotation narrative, often called 'Solana season,' where SOL can outperform or underperform Bitcoin and Ethereum for stretches independent of what either of those charts are doing. The read adapts to whatever price action is visible on your SOL screenshot rather than assuming it tracks BTC or ETH. If you want to check the relationship directly, upload a SOL/BTC or SOL/ETH ratio chart and grade that the same way.
Does it work for SOL futures and the spot Solana ETF (BSOL, GSOL)?
Yes. Spot SOL/USD, SOLUSDT pairs, perpetual SOL futures, and spot Solana ETF charts like BSOL or GSOL all work. SnapPChart reads the chart image, not the instrument type, so the analysis adapts to whatever price scale and timeframe is visible. Some of these ETFs include built-in staking exposure; the grade never calculates or verifies that staking yield, since it only reads what is drawn on the chart.
Can AI tell if a SOL dip is a healthy pullback or the start of a deeper breakdown?
The AI grades what the chart shows: whether the dip is basing at a level with confluence and starting to reclaim it, or still breaking down with no structure underneath it. Solana tends to trade with higher beta than Bitcoin or Ethereum, so its pullbacks can look sharper on the same percentage move, and the grade weighs that against the structure actually visible rather than assuming every dip is proportionally worse. The bear case names the level that would invalidate a healthy-pullback read.
Why re-grade a Solana chart after a fast pump or a weekend candle?
A SOL chart can change shape faster than most: a pump.fun-driven token launch or a meme-coin rotation can pull volume and momentum into SOL itself within a single session, and Solana also keeps trading through the weekend while broader markets sit closed. A grade only describes the exact screenshot it was given, so a setup that looked clean an hour ago, or before the weekend, is not guaranteed to still look clean now. Upload the current chart rather than trusting an older read.
Is there a free trial to test the Solana grader?
Yes. New users get 2 lifetime chart analyses to test the grader on a real SOL setup, no credit card required. The first analysis is full depth; the second is gated so you can see what the paid product adds.
Upload your Solana chart free.
Get a SOL setup grade, trade plan, and risk notes in seconds.
Analyze a Solana Chart Free