What to Track in a Trading Journal (and What's Just Noise)
Half the fields in a trading journal are noise. The signal is whether your setup grades predicted the outcome. Here are the journal metrics worth tracking and the ones to drop.
Most trading journals track too much. Twenty columns, an emotion slider, a paragraph of notes per trade, screenshots you save and never open again. It feels rigorous. It is mostly noise, because almost none of it gets reviewed and even less of it changes a decision. There is really one relationship worth tracking, and it answers the only question that matters: did your good setups actually do better than your bad ones? This post is about what to track in a trading journal to find that signal, and what to throw out.
What Should You Track in a Trading Journal?
Track only the fields you will review and that change a decision. The core set is small: the pre-trade grade for each setup, the outcome, whether you followed the plan, and whether you took the trade or skipped it. From those four you get the metrics that matter, accuracy by grade band, take rate versus skip rate, and grade distribution. Drop the emotion sliders, long narrative notes, and dozens of extra columns, because if you would not act on a field, tracking it is just noise.
Most Journal Fields Are Noise
Open a typical journal template and count the columns. Ticker, date, time, entry, exit, size, stop, target, R-multiple, setup type, market condition, emotion before, emotion after, confidence, a notes field, a screenshot link. Sixteen fields per trade. The implicit promise is that more data means more insight. In practice, more data means more friction at capture and a review you never do because there is too much to look at.
A field is only worth tracking if you will review it and it can change a decision. By that test, most of those columns fail. The emotion sliders are the worst offenders. You fill them in after the trade, which means you rate the emotion based on whether you won, not on what you actually felt at entry. A winner gets "confident," a loser gets "anxious," even when the setups were identical. The field is recording the outcome wearing a costume.
The cost of all this noise is not just wasted typing. It buries the signal. When sixteen columns all look equally important, the two or three that actually matter get the same glance as the twelve that do not. Strip the journal down and the real signal stands out. The capture also gets light enough to survive a bad week, which is the failure mode we covered in the post on keeping a trading journal you will actually stick with. If your current journal already has the pre-trade grade column, you are most of the way there. If it does not, that is the one field worth adding before any other.
The One Relationship That Matters
Strip everything away and a trade journal exists to answer one question: did your pre-trade read predict the outcome? Everything else is detail. If you can attach a grade to each setup before you enter, and an outcome to each trade after, the relationship between those two columns is the entire game. It tells you whether your judgment is worth trusting and where it breaks.
This is why a journal built on pre-trade grades is more useful than one built on after-the-fact notes. A note written from memory is reconstructed to match the result, so the "prediction" column is contaminated by the outcome it is supposed to be tested against. A grade assigned before entry is a real prediction, fixed before you knew anything. The case for journaling at entry rather than after is the whole argument of the post on trading journal vs pre-trade grading.
From that one relationship, a few metrics fall out, and they cover what most day traders need: accuracy by grade band, take rate versus skip rate, and grade distribution. The rest of this post is each of those in turn.
Accuracy by Grade Band
This is the most important number in your journal, full stop. Take every trade, group it by the grade the setup received before entry, and compute the hit rate for each band. A and A+ in one bucket, B and B+ in another, C and C+ in another, D and F in the last. Now look at the win rate per band.
What you want to see is a clean staircase: A setups win more often than B setups, which win more often than C setups. If you see that, your grade is a real edge, and the rule "only take A and B+" is backed by your own data instead of someone else's blog post. If the staircase is flat, or your B setups are somehow beating your A setups, something is off, either in how the setups are graded or in how you execute them, and the only way to catch that is to track it.
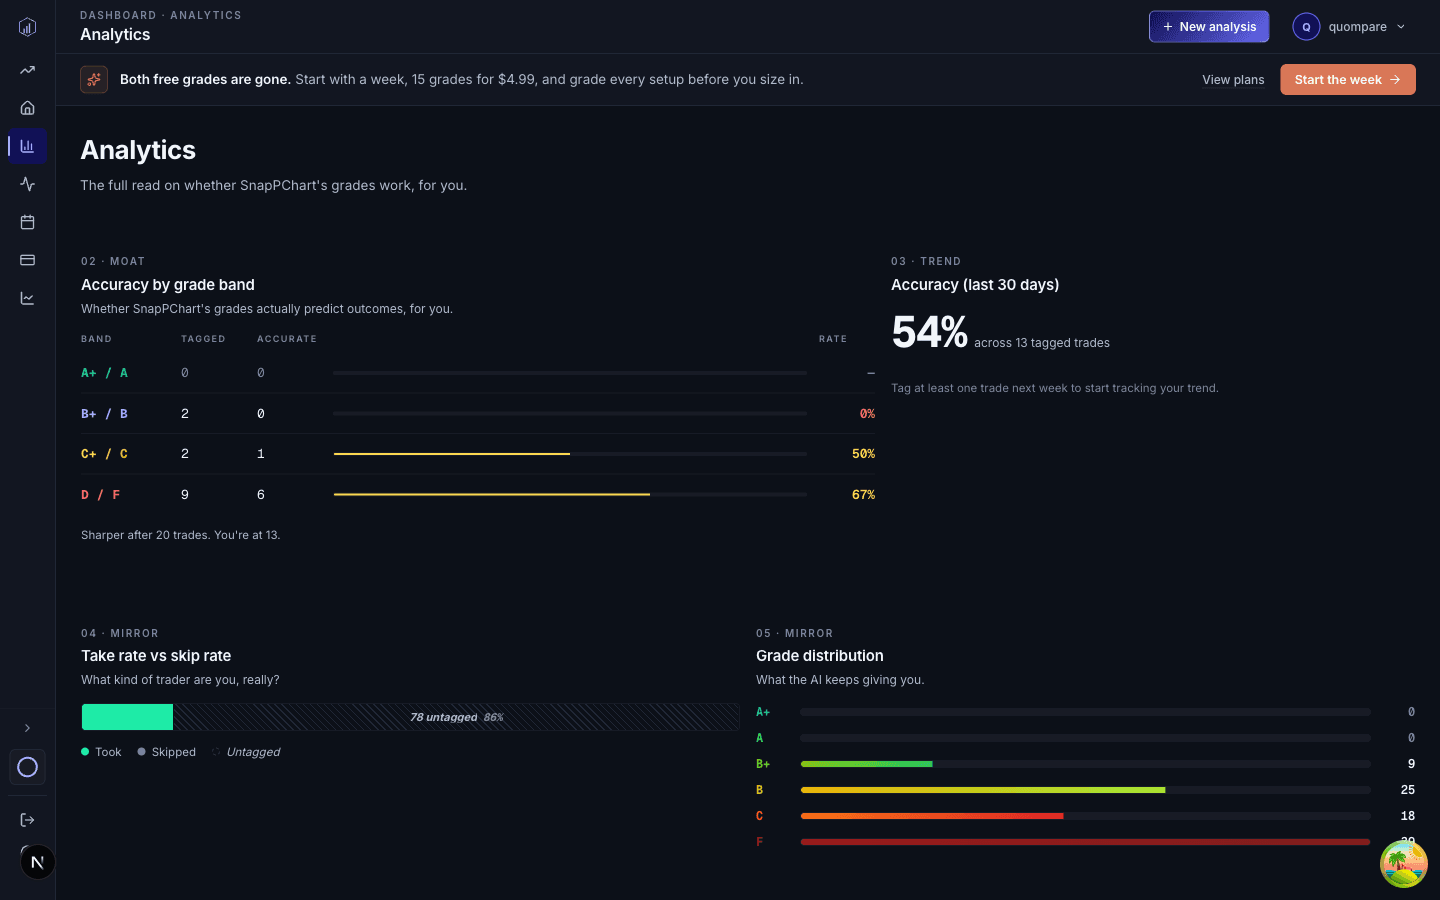
Computing this by hand is tedious, which is part of why most traders never do it. You have to tag every trade with a grade, keep the grades honest, and recompute the bands as the sample grows. When the grade is assigned automatically at entry, the band accuracy is just a rollup the journal can show you. The mechanics of getting a consistent grade on each setup are in the guide on grading trades before entering.
Take Rate vs Skip Rate
Accuracy by grade band tells you whether the grade is good. Take rate versus skip rate tells you whether you are actually using it. For each grade band, what share of those setups did you take, and what share did you skip? This is discipline expressed as a number, and numbers are harder to argue with than the story you tell yourself about how disciplined you have been.
The pattern you want is obvious once you see it. High take rate on A and B+ setups, high skip rate on Cs and below. If your skip rate on C-grade setups is low, you are taking the marginal trades that quietly bleed an account, and the journal puts a number on exactly how often. That is the slow leak described in the post on how to avoid bad trades, made visible.
Healthy pattern
You take most of your A and B+ setups and skip most of your Cs. The grade is functioning as a gate. Your take rate and skip rate are tracking your grading, which means execution matches intent.
Leak pattern
Your skip rate on C setups is low. You keep talking yourself into marginal trades, usually when something is moving and FOMO kicks in. The journal flags it before it shows up as a drawdown.
This metric only exists if you record skips, not just trades. A journal that only logs the trades you took is blind to the discipline question, because the trades you correctly avoided leave no row. Grading every setup, including the ones you pass on, is what makes skip rate measurable in the first place. The next setup you grade is the first data point in that number.
See If Your A Setups Beat Your C Setups
Grade the next setup and the grade goes on record before the outcome. Over time, the journal shows whether the A setups you took actually outperformed the Cs you skipped. Your first analysis is free.
Grade a Setup FreeGrade Distribution: Are You Only Offered Cs?
The third metric is the shape of your grades over time. Of every setup you graded this week, how many came back A, B, C, or worse? This is easy to overlook because it is not about any single trade, but it tells you something the other two cannot: what the market is actually offering you, and whether you are fishing in the right pond.
If your distribution is mostly Cs and Ds week after week, the problem is upstream of your discipline. You are scanning a watchlist or a market regime that simply is not producing clean setups. No amount of willpower fixes that; you change what you are looking at. A choppy, low-volume market produces low grades for a reason, and the right move is often to trade less, not to force the Cs you do have. The strategy side of this is covered in the momentum trading strategy playbook.
A healthy distribution has a real population of A and B setups to choose from. When it does, the discipline question (take rate vs skip rate) actually means something, because you have good setups available to take. When it does not, a low take rate is not discipline, it is just an empty market, and the journal helps you tell those two apart instead of beating yourself up over a week with nothing to trade.
Track These, Drop These
Here is the whole thing as a list you can act on. The left column earns its place because you will review it and it changes a decision. The right column is friction you can delete today without losing anything you actually use.
| Field | Track or drop | Why |
|---|---|---|
| Pre-trade grade | Track | The prediction. Everything else is measured against it. |
| Outcome (win/loss, R) | Track | The result. Pairs with the grade to test your read. |
| Take or skip | Track | Makes skip rate and discipline measurable. |
| Followed plan? (y/n) | Track | Separates good losses from real mistakes. |
| Setup type | Track | Lets you see which patterns you actually win. |
| Emotion slider (1-10) | Drop | Rated from the outcome, not the entry. Pure noise. |
| Long narrative notes | Drop | Write-once, review-never. One line max if any. |
| Confidence score | Drop | Duplicates the grade, less consistently. |
| Market condition tag | Drop | Grade distribution already captures this. |
| Manual screenshot link | Drop | The graded screenshot already is the entry. |
Five fields to track, five to drop. The five you keep all feed the three metrics from earlier. The five you drop are the ones that made your old journal a chore you abandoned. Less to capture, more to learn. The reason to keep the discipline distinction ("followed plan?") is the same one behind the work on building trading discipline as a system: a losing trade that followed the plan is a good trade, and a winning trade that broke it is a bad one.
The Review That Actually Changes Things
Tracking the right metrics is only half of it. The review is where they pay off, and a good review is short and pointed because the metrics are short and pointed. Once a week, you are answering three questions, not staring at a wall of columns.
Did the grade hold?
Look at accuracy by grade band. Is the staircase intact? A setups beating B setups beating C setups means your read is an edge worth trusting. A flat or inverted staircase is a flag to dig into.
Did I follow it?
Look at take rate vs skip rate. Did you skip your Cs and take your A and B+ setups? If your C skip rate slipped, that is a specific, fixable behavior to watch next week.
What was I offered?
Look at grade distribution. A market full of Cs means trade less, not harder. A healthy spread of A and B setups means the discipline question is the real one.
That is a ten-minute review that actually moves your trading, versus an hour of scrolling sixteen columns that moves nothing. The thinking behind grade-quality and confluence, the stuff the grade is built on, gets unpacked in the academic-flavored discussion of whether AI day trading is profitable. For the broader idea of forcing structure into a discretionary process, the Investopedia primer on building a trading plan is a solid foundation, and the principle of measuring against a written process echoes guidance from FINRA on the risks of active day trading.
If you want the metrics computed for you instead of maintained in a spreadsheet, grade your setups on the AI chart analysis tool and the band accuracy, take rate, and distribution roll up on their own. The point is not the dashboard, it is the question it answers: are your good setups actually better than your bad ones, and are you taking the right ones?
Frequently Asked Questions
What should I track in a trading journal?
Track the things you will actually review and that change a decision. The core set is small: your pre-trade grade for each setup, the outcome, whether you followed the plan, and the take-or-skip call. From those you can compute accuracy by grade band, take rate versus skip rate, and grade distribution. Everything else (emotion sliders, long narrative notes, dozens of columns) tends to be write-once, review-never. If you would not act on a field, do not track it.
What is accuracy by grade band?
It is the hit rate of your trades split out by the grade the setup received before entry. A setups in one bucket, B setups in another, C setups in another, each with its own win rate. It is the single most important number in a trade journal because it answers the question the whole system rests on: did your higher grades actually win more often than your lower grades? If they did, the grade is a real edge. If they did not, your grading needs work.
What is take rate vs skip rate?
Take rate is the share of setups you graded that you actually traded; skip rate is the share you passed on. Tracked against grade, it measures discipline directly. A disciplined trader has a high take rate on A and B+ setups and a high skip rate on C setups. If you are taking a lot of C-grade setups, the number shows it in black and white, which is harder to argue with than a vague sense that you have been undisciplined lately.
Are emotion ratings worth tracking in a trading journal?
Rarely, and almost never as a numeric slider you fill in after the fact. The retrospective emotion score is noise: you rate it based on the outcome, not on what you actually felt at entry. If emotion matters to you, capture it as one short note at the moment of the trade, not a 1-to-10 scale you reconstruct later. Most traders find they never review the emotion column anyway, which is the real test of whether a field earns its place.
How often should I review my trading journal?
A light daily touch and a real weekly review works for most day traders. Daily, you confirm the day got logged and add outcomes. Weekly, you look at accuracy by grade band, take versus skip rate, and grade distribution over the week. Monthly you can zoom out to see whether your edge is holding. The trap is reviewing constantly with no structure; pick the three or four metrics that change behavior and check those on a schedule.
Disclaimer: This article is for educational and informational purposes only. It does not constitute financial advice. Day trading involves substantial risk of loss and is not suitable for every investor. Journal metrics describe past behavior and do not guarantee future results. Always do your own research and never trade with money you cannot afford to lose.
Related Posts
Writes about AI-assisted day trading, technical analysis, and the systems traders actually use to stay disciplined.
Find Out If Your A Setups Are Actually Better
Grade each setup before entry and the journal tracks accuracy by grade band automatically. If the staircase is real, you have an edge. If it is flat, you know before the damage adds up. Your first analysis is free.