Grade your AUD/JPY setup before the risk-on move runs.
Upload an AUD/JPY chart screenshot and SnapPChart reads the structure, the pullback into the 9 and 20 EMA, the whole-figure and half-figure round numbers the Aussie-yen cross respects, and the visible tick volume, then returns a setup grade, entry, stop, targets, and the reward against the risk. Built for the Aussie-yen cross with no USD leg, the carry-trade and risk-sentiment cross that traders read as a risk-on or risk-off barometer.
AUD/JPY
The Aussie-yen cross, no USD leg, a risk-sentiment barometer
ROUND NUMBERS
95.00 / 96.00 whole and half figures
EMA
Pullback into the 9 and 20 EMA on a clean trend
ASIAN SESSION
Active in the Asian session and on risk-on/off shifts
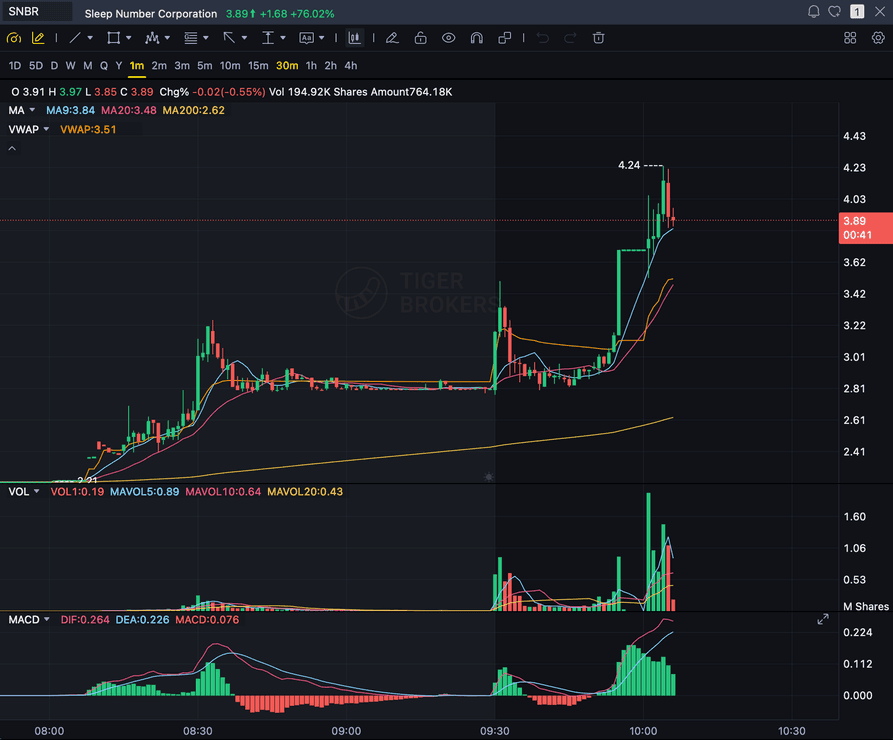
Grade
B+
Entry
$3.87
Stop
$3.75
Target
$4.24
Sample readout
SNBR 1m bull flag pullback: strong opening momentum, lighter-volume consolidation, and a late breakout attempt with the 3.89 price marker near the current candle.
Quick answer
How do you analyze an AUD/JPY chart with AI?
You screenshot the AUD/JPY chart from your platform and upload the image. SnapPChart reads it directly, the market structure, the pullback into the 9 EMA or 20 EMA, the whole-figure and half-figure round numbers the Aussie-yen cross tends to respect (95.00, 96.00), and the visible tick volume, then grades the setup A+ to F with an entry, a structural stop in pips, multi-target exits, and the reward against the risk. AUD/JPY is the Aussie-yen cross with no USD leg, and traders treat it as a risk-sentiment barometer and a carry-trade cross, because the Australian dollar is a higher-yielding commodity currency tied to China demand and commodity sentiment while the yen is the low-yield funding currency, so the pair tends to rise when risk appetite is on and fall in risk-off. That character is background context you bring to the chart, not data the grader reads. The pair is most active in the Asian session, when the Aussie side trades alongside Sydney and Tokyo, and it also moves on risk-sentiment shifts through the London and US hours, then goes quieter and choppier in the dead off-hours, so reading trend versus chop off the chart is half the job. The grader checks exactly that. It does not read live AUD/JPY prices, does not watch the dollar index, does not pull the Reserve Bank of Australia or Bank of Japan calendar, does not read Australian data or China data or commodity and iron-ore prices, and does not cross-reference other pairs, including the AUD/USD or USD/JPY legs. It grades what is visible on the chart you upload, using the same criteria every time, so you can compare one Aussie-yen setup to the next instead of trading on feel.
What the AI Returns From a Screenshot
Use the output as a repeatable pre-trade checkpoint, not a prediction.
A-F Setup Grade
See whether the setup has enough pattern clarity, momentum, volume, and reward to justify the risk.
Entry, Stop, Targets
Get a structured trade plan with entry zone, invalidation level, targets, and risk/reward.
Screenshot-Based Read
Use charts from TradingView, Webull, ThinkOrSwim, MetaTrader, Robinhood, or any broker.
Risk Notes First
The analysis flags extension, messy chop, weak retests, thin reward, and conflicting indicators.
Workflow
Use it as a pre-entry gate on every AUD/JPY setup
The Aussie-yen cross trends cleanly in the Asian session and on clean risk-sentiment shifts and chops in the dead off-hours, and a clean-looking pullback in an off-hours range is a classic trap. SnapPChart gives you a consistent quality check on the AUD/JPY chart before you commit.
- Grade an AUD/JPY pullback into the 9 or 20 EMA before the entry
- Check the round-number level (95.00, 96.00) the Aussie-yen cross is reacting to
- Confirm the chart is trending, not an off-hours chop box
- Confirm the structural stop has room for the pair's risk-driven swings, not a tight stop that gets whipped
- Read the bear case and invalidation before you size the position
- Skip C-grade Aussie-yen setups where the reward is not there
Head to head
SnapPChart vs a general AI chat assistant for chart screenshots
Most traders land here after pasting a chart into a general AI tool and getting a vague description. Here is how a purpose-built screenshot grader compares for the last decision before you risk money.
| Feature | SnapPChart | General AI chat assistant |
|---|---|---|
| Reads any chart screenshot | Every upload | Inconsistent |
| Setup grade (A+ to F) | Yes | No |
| Entry, stop, and targets | Every upload | Varies by prompt |
| Same criteria every time | Fixed methodology | Varies by prompt |
| Multi-target exit plan (T1 / T2) | Yes | Rarely consistent |
| Risk/reward + invalidation | Yes | Inconsistent |
| Speed to a decision | Seconds | Prompting required |
| Grade history to review | Yes | No |
Keep Learning the Setup
Use these guides to understand how SnapPChart grades the trade instead of taking the output blindly.
AUD/JPY Chart Analysis FAQ
How SnapPChart grades an AUD/JPY chart from a screenshot.
How do I analyze an AUD/JPY chart with AI?
Screenshot the AUD/JPY chart from your platform and upload the image to SnapPChart. A multimodal vision model reads the structure, the pullback into the 9 and 20 EMA, the whole-figure and half-figure round numbers, and visible tick volume directly from the picture, then returns a setup grade, an entry, a structural stop in pips, targets, and the reward against the risk. You do not type out what the chart shows or connect a data feed.
Does it read live AUD/JPY prices, the dollar index, or the RBA and Bank of Japan?
No. SnapPChart grades the AUD/JPY chart screenshot you upload, not a live feed. It does not read live AUD/JPY prices, does not watch the dollar index, does not pull the Reserve Bank of Australia or Bank of Japan calendar, does not read Australian data such as jobs or CPI, China data, or commodity and iron-ore prices, and does not cross-reference other pairs, including the AUD/USD or USD/JPY legs. The RBA and Bank of Japan policy divergence, the rate-differential carry story, yen intervention risk from Japan's authorities, China and commodity sentiment, and the risk-on or risk-off character the Aussie-yen cross is read against are things you know before you sit down, not data the grader reads. It reads the structure, the EMA pullback, the round numbers, and the tick volume that are visible in the image and returns the trade plan and the bear case. You stay the decision-maker.
Why is AUD/JPY called a risk-sentiment or carry-trade cross, and how does that change the grade?
AUD/JPY is the Aussie-yen cross with no USD leg, and traders treat it as a risk-sentiment barometer and a carry-trade cross. The Australian dollar is a higher-yielding commodity currency tied to China demand and commodity sentiment, while the yen is the low-yield funding currency, so the pair tends to rise when risk appetite is on, with equities up and carry trades in favor, and fall in risk-off, and many traders watch it alongside the equity indices. That is all background context you bring to the chart, not something the grader sees. The grader still only reads the structure, the EMA pullback, the round numbers, and the tick volume that are visible in the image, the same criteria every time, so it does not read risk sentiment, equities, or the carry differential. It trends cleanly in the Asian session and on clean risk-sentiment shifts and chops in the dead off-hours, and reading trend versus chop off the chart is half the work.
Are the entry, stop, and targets in pips?
Yes. AUD/JPY is a yen pair quoted to two or three decimals where a pip is 0.01, and the entry, structural stop, and targets are returned in pip-friendly terms with the underlying prices, and the reward is measured against the risk in pips after spread. The grader looks for a minimum reward-to-risk that holds up after spread, and it gives the structural stop room for the pair's risk-driven swings rather than a tight stop that gets whipped out before the trade works.
Can it grade an AUD/JPY short setup?
SnapPChart is optimized for long (buy) momentum setups. Short setups, options, and hedging are out of scope by design. On a pair that swings both ways with risk sentiment, the honest answer is that the grader is tuned for the long side, so use it for the long pullback setups it understands well.
Is AUD/JPY chart analysis free to try?
Yes. New users get two lifetime chart analyses, no credit card required. The first analysis shows the full depth so you can see exactly what the AI returns from an AUD/JPY chart; the second is gated to show what the paid product adds.
Grade your next AUD/JPY setup before you enter.
Upload the Aussie-yen chart from the homepage and get a structured read on the AUD/JPY setup in seconds. No credit card required.
Grade an AUD/JPY Chart Free