Grade your SPX setup before you take the trade.
Upload an SPX (S&P 500 / US 500) chart screenshot and SnapPChart reads the structure, the key levels the broad-market benchmark respects, and the EMA pullback context, then returns a setup grade, entry, stop, targets, and the reward against the risk. Built for index-CFD and prop-firm scalpers.
SPX
S&P 500 / US 500 broad-market index CFD setups
LEVELS
Well-watched levels the benchmark respects
EMA
Pullback and reclaim context on the index chart
R:R
Reward measured against a structural stop
Grade
B+
Entry
$3.87
Stop
$3.75
Target
$4.24
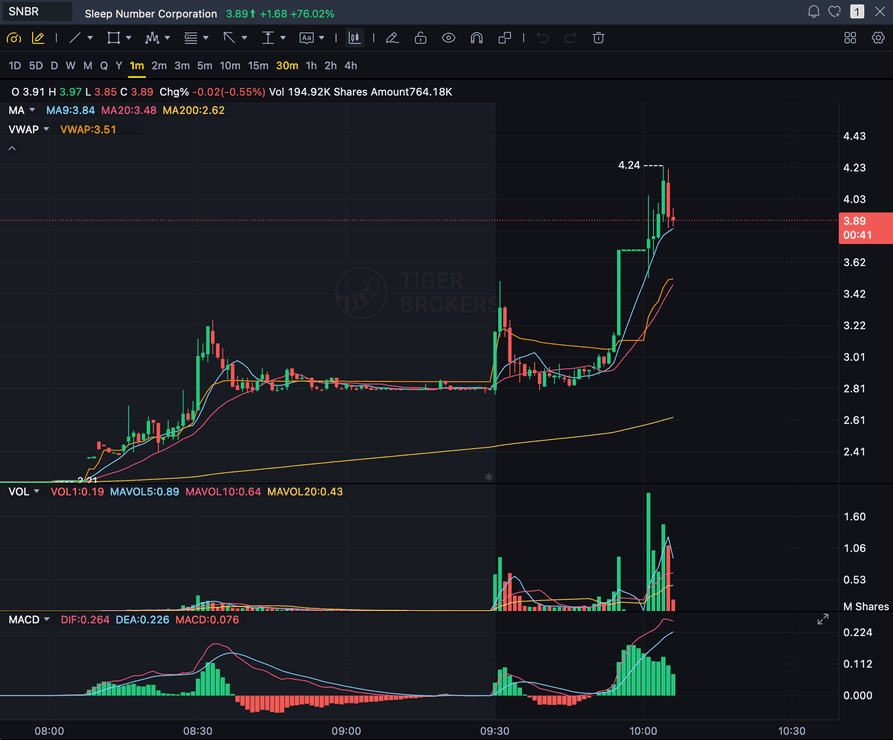
Sample readout
SNBR 1m bull flag pullback: strong opening momentum, lighter-volume consolidation, and a late breakout attempt with the 3.89 price marker near the current candle.
Quick answer
How do you analyze an SPX chart with AI?
You screenshot the SPX chart from your platform and upload the image. SnapPChart reads it directly, the market structure, the key levels the index respects, the EMA pullback context, and the visible volume, then grades the setup A+ to F with an entry, a structural stop, multi-target exits, and the reward against the risk. SPX is the index CFD that tracks the S&P 500, the basket of 500 large-cap US companies and the broad-market benchmark most traders watch as the overall risk read. Because it is so widely traded, it tends to respect clean structure and well-watched levels, which is exactly what the grader checks. It does not read live index data, does not pull the economic calendar, and does not see futures order flow. It grades what is visible on the chart you upload, using the same criteria every time, so an index-CFD or prop-firm scalper can compare one SPX setup to the next instead of trading on feel.
What the AI Returns From a Screenshot
Use the output as a repeatable pre-trade checkpoint, not a prediction.
A-F Setup Grade
See whether the setup has enough pattern clarity, momentum, volume, and reward to justify the risk.
Entry, Stop, Targets
Get a structured trade plan with entry zone, invalidation level, targets, and risk/reward.
Screenshot-Based Read
Use charts from TradingView, Webull, ThinkOrSwim, MetaTrader, Robinhood, or any broker.
Risk Notes First
The analysis flags extension, messy chop, weak retests, thin reward, and conflicting indicators.
Workflow
Use it as a pre-entry gate on every SPX setup
SPX is the broad-market read, and a late or sloppy entry still costs real money on a funded account. SnapPChart gives you a consistent quality check on the index chart before you commit.
- Grade an SPX breakout or pullback before the entry
- Check the well-watched level the benchmark is reacting to
- Confirm the EMA pullback context supports the long
- Read the bear case and invalidation before you size on a funded account
- Re-grade the chart after a pullback to see if the setup got cleaner
- Skip C-grade index setups where the reward is not there
Head to head
SnapPChart vs a general AI chat assistant for chart screenshots
Most traders land here after pasting a chart into a general AI tool and getting a vague description. Here is how a purpose-built screenshot grader compares for the last decision before you risk money.
| Feature | SnapPChart | General AI chat assistant |
|---|---|---|
| Reads any chart screenshot | Every upload | Inconsistent |
| Setup grade (A+ to F) | Yes | No |
| Entry, stop, and targets | Every upload | Varies by prompt |
| Same criteria every time | Fixed methodology | Varies by prompt |
| Multi-target exit plan (T1 / T2) | Yes | Rarely consistent |
| Risk/reward + invalidation | Yes | Inconsistent |
| Speed to a decision | Seconds | Prompting required |
| Grade history to review | Yes | No |
Keep Learning the Setup
Use these guides to understand how SnapPChart grades the trade instead of taking the output blindly.
SPX Chart Analysis FAQ
How SnapPChart grades an SPX S&P 500 index chart from a screenshot.
How do I analyze an SPX chart with AI?
Screenshot the SPX chart from your platform and upload the image to SnapPChart. A multimodal vision model reads the structure, the key levels, the EMA pullback context, and visible volume directly from the picture, then returns a setup grade, an entry, a structural stop, targets, and the reward against the risk. You do not type out what the chart shows or connect a data feed.
Does it read live SPX data or the economic calendar?
No. SnapPChart grades the SPX chart screenshot you upload, not a live index feed. It does not pull the economic calendar, does not see futures order flow, and does not predict the next candle. It reads the structure, the key levels, and the EMA context that are visible in the image and returns the trade plan and the bear case. You stay the decision-maker.
What makes the S&P 500 different from the tech and Dow indices?
SPX tracks the S&P 500, 500 large-cap US companies across every sector, so it is the broadest-market benchmark and tends to be less concentrated than the tech-heavy Nasdaq 100 or the 30-name Dow. In practice it tends to respect clean structure and the well-watched levels everyone is looking at. SnapPChart factors those levels into the structure read when they are visible on the chart you upload.
Is it useful for index-CFD and prop-firm scalpers?
Yes. SPX is a core index CFD on funded accounts, and the value of the grader is consistency: it returns the same structured fields on every chart, so you can compare one SPX setup to the next and skip the C-grade trades that eat into prop-firm drawdown limits. It grades the long setup in front of you rather than scanning for new ones.
Can it grade an SPX short setup?
SnapPChart is optimized for long (buy) momentum setups. Short setups, options, and hedging are out of scope by design. On an index that swings both ways, the honest answer is that the grader is tuned for the long side, so use it for the long setups it understands well.
Is SPX chart analysis free to try?
Yes. New users get two lifetime chart analyses, no credit card required. The first analysis shows the full depth so you can see exactly what the AI returns from an SPX chart; the second is gated to show what the paid product adds.
Grade your next SPX setup before you enter.
Upload the S&P 500 chart from the homepage and get a structured read on the SPX setup in seconds. No credit card required.
Grade an SPX Chart Free