Screenshot the range, grade the breakout.
Upload a chart with the opening range and the breakout visible and get a read on the break of the range high, the volume behind it, whether the level is flipping to support, and a full trade plan, so a clean ORB and a chase do not get judged the same way.
ORB
The opening-range high break you screenshot
1M / 5M
Intraday timeframes where the range forms
VOLUME
Conviction behind the breakout candle
LEVELS
Range high flipping to new support
Grade
B+
Entry
$3.87
Stop
$3.75
Target
$4.24
Sample readout
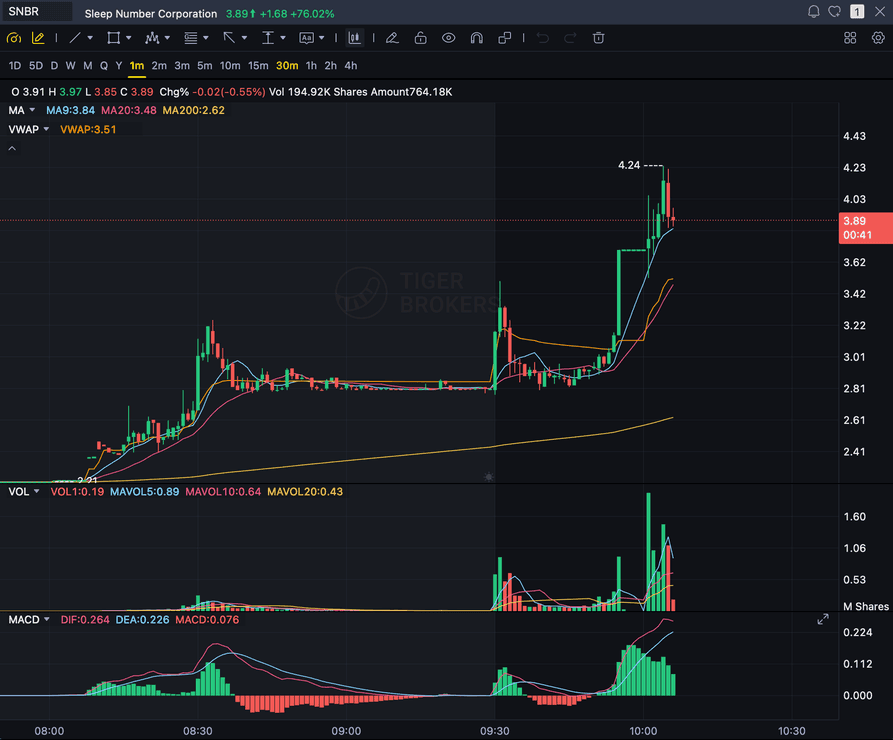
SNBR 1m bull flag pullback: strong opening momentum, lighter-volume consolidation, and a late breakout attempt with the 3.89 price marker near the current candle.
Quick answer
What is an opening range breakout, and can AI grade it?
An opening range breakout (ORB) is when price breaks out of the high or low of the range set during the first part of the session, the most-watched version being the first 5, 15, or 30 minutes. SnapPChart grades that breakout from the chart you upload: it reads the break of the range high, whether the breakout candle came with volume, whether the range high is flipping from resistance into support, and the EMA and VWAP context, then returns a setup grade, an entry, a structural stop back inside the range, multi-target exits, and the bear case. It does not read the clock and it does not detect the market open or auto-draw the range. You mark or screenshot the chart with the opening range and the breakout visible, and the same checklist runs every time so a clean breakout and a low-volume chase get judged on the same standard.
What the AI Returns From a Screenshot
Use the output as a repeatable pre-trade checkpoint, not a prediction.
A-F Setup Grade
See whether the setup has enough pattern clarity, momentum, volume, and reward to justify the risk.
Entry, Stop, Targets
Get a structured trade plan with entry zone, invalidation level, targets, and risk/reward.
Screenshot-Based Read
Use charts from TradingView, Webull, ThinkOrSwim, MetaTrader, Robinhood, or any broker.
Risk Notes First
The analysis flags extension, messy chop, weak retests, thin reward, and conflicting indicators.
Workflow
Use it as a quality check on the breakout
Opening-range breakouts fail when they break on thin volume or chase a candle that is already extended. SnapPChart gives you a consistent read before you commit to the break.
- Screenshot the chart with the opening range and the break visible
- Check whether the breakout candle cleared the range high with volume
- Confirm the range high is flipping from resistance to support
- Read the 9 EMA, 20 EMA, and VWAP context around the break
- Re-grade after a pullback to the range high to see if the retest is cleaner
- Skip the breakout when the grade flags thin volume or an extended chase
Head to head
SnapPChart vs a general AI chat assistant for opening range breakouts
A general AI tool can describe a breakout, but it will not grade the opening-range break to a fixed standard. SnapPChart checks the break of the range high, the volume, and the level flip the same way on every screenshot you upload.
| Feature | SnapPChart | General AI chat assistant |
|---|---|---|
| Grades the opening-range breakout you screenshot | Yes, every upload | Inconsistent |
| Checks volume behind the breakout candle | Every grade | Rarely |
| Reads the range high as new support | From the image | Varies by prompt |
| Flags a failed breakout / chase | Every bear case | Rarely flagged |
| Entry, stop, targets off the range | Yes | Prompting required |
| Same criteria on every breakout | Fixed methodology | Varies by session |
Learn the opening range breakout
Use these guides to understand what makes a breakout grade well, so you take the read instead of the output blindly.
Opening Range Breakout AI FAQ
How SnapPChart grades an ORB from your screenshot.
How does the AI grade an opening range breakout?
It reads the break of the range high on the chart you upload, whether the breakout candle came with volume, and whether the range high is flipping from resistance to support. It factors the 9 EMA, 20 EMA, and VWAP context into the grade, then returns a setup grade, an entry, a structural stop back inside the range, and targets. A clean break with volume grades higher than a thin-volume poke above the range that fails.
Does SnapPChart know the market open or read the clock?
No. It does not read the clock, does not know what time the session opened, and does not auto-detect or draw the opening range. You decide the range and screenshot the chart with the range and the breakout visible. The grade reflects the structure in the picture you give it, not a live session timer.
Do I need to mark the opening range before I upload?
It helps. Because the AI reads the image, the clearer the opening range high and low are on the chart, the better the read. Mark the range with a box or lines, or screenshot a timeframe where the range and the break are both obvious, then upload that.
Can it tell a real breakout from a chase?
It flags the chase risk in the bear case. If the breakout candle is extended, broke on thin volume, or is far from the range high with no pullback, the grade drops and the trade plan calls out the failed-breakout risk. A break that cleared the range with volume and is holding above it grades better.
What timeframes work best for an ORB?
1-minute and 5-minute charts are where the opening range and the breakout are clearest. Upload the timeframe you would actually trade the break from, with volume and your key moving averages visible, so the AI has the context that matters.
Is there a free trial for ORB grading?
Yes. New users get two lifetime chart analyses. The first shows the full output so you can see exactly what the breakout grade returns; the second is gated to show what the paid product adds. No credit card required.
Grade the breakout before you click buy.
Screenshot the chart with the opening range and the break visible, and upload it from the homepage for a structured read.
Grade an ORB Setup Free