Grade your USD/ZAR setup before the London session moves it.
Upload a USD/ZAR chart screenshot and SnapPChart reads the structure, the pullback into the 9 and 20 EMA, the whole-rand and half-rand round numbers the pair respects, and the visible tick volume, then returns a setup grade, entry, stop, targets, and the reward against the risk. Built for South Africa's rand, one of the most actively traded emerging-market currencies, which trades roughly 16 to 17 rand per dollar and carries a real commodity-exporter character alongside its emerging-market swings.
Drag and drop your chart screenshot
or click to browse. PNG, JPG, or WebP.
Your first analysis is free. No credit card.
Make sure both the time axis (X) and price axis (Y) are visible in your screenshot for accurate results.
Grade
B+
Entry
$3.87
Stop
$3.75
Target
$4.24
Sample readout
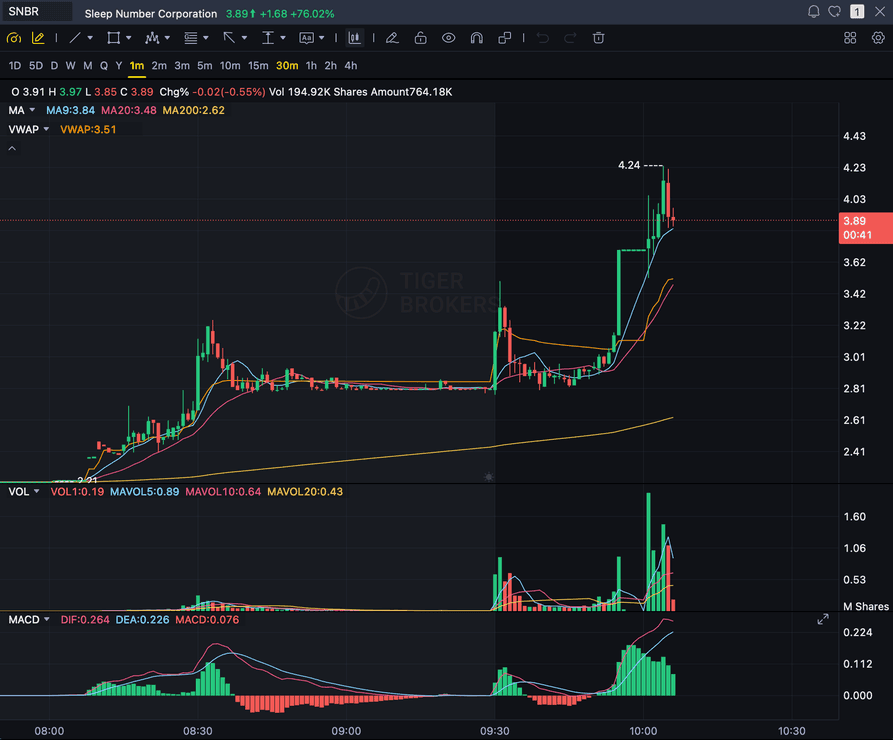
SNBR 1m bull flag pullback: strong opening momentum, lighter-volume consolidation, and a late breakout attempt with the 3.89 price marker near the current candle.
USD/ZAR
The rand, a liquid emerging-market major
ROUND NUMBERS
Whole-rand levels like 16.00 / 16.50 / 17.00
EMA
Pullback into the 9 and 20 EMA on a clean trend
LONDON SESSION
Most active in London; SARB and metals move the pair
Quick answer
How do you analyze a USD/ZAR chart with AI?
You screenshot the USD/ZAR chart from your platform and upload the image. SnapPChart reads it directly, the market structure, the pullback into the 9 EMA or 20 EMA, the round-number levels the rand tends to respect, and the visible tick volume, then grades the setup A+ to F with an entry, a structural stop, multi-target exits, and the reward against the risk. USD/ZAR, the South African rand, is a free-floating and genuinely liquid pair, not a pegged or thinly-traded currency, and it is one of the most actively traded emerging-market currencies globally, widely used as a liquid risk-sentiment proxy trade, so it swings harder on global risk-on and risk-off shifts than a G7 cross. South Africa is also a major gold and platinum-group-metals exporter, which gives the rand a real, if imperfect, correlation to metals and broader commodity-currency behavior, a different personality from a pair whose story is manufacturing or trade flows. USD/ZAR trades roughly 16 to 17 rand per dollar and is quoted to 2 decimals, not the 4-decimal pip convention of a G7 major, so the round numbers that matter are whole-rand levels like 16.00, 16.50, and 17.00. It is most actively traded during the London session and the London-New-York overlap, when South African business hours line up with Europe, and goes quieter in the Asian session. The South African Reserve Bank, SARB, is the central bank whose rate decisions move the pair the way the Bank of Canada moves USD/CAD or Banxico moves USD/MXN. The grader checks structure, not any of that. It does not read live USD/ZAR prices, does not read SARB's calendar, does not read gold or platinum-group-metals prices or commodity data, does not read risk-sentiment or emerging-market flow data, and does not cross-reference other pairs. It grades what is visible on the chart you upload, using the same criteria every time, so you can compare one rand setup to the next instead of trading on feel.
What the AI Returns From a Screenshot
Use the output as a repeatable pre-trade checkpoint, not a prediction.
A-F Setup Grade
See whether the setup has enough pattern clarity, momentum, volume, and reward to justify the risk.
Entry, Stop, Targets
Get a structured trade plan with entry zone, invalidation level, targets, and risk/reward.
Screenshot-Based Read
Use charts from TradingView, Webull, ThinkOrSwim, MetaTrader, Robinhood, or any broker.
Risk Notes First
The analysis flags extension, messy chop, weak retests, thin reward, and conflicting indicators.
Workflow
Use it as a pre-entry gate on every USD/ZAR setup
The rand is a higher-beta emerging-market major that can swing hard on global risk sentiment and commodity moves, and a clean-looking pullback into a risk-off spike is a classic trap. SnapPChart gives you a consistent quality check on the USD/ZAR chart before you commit.
- Grade a USD/ZAR pullback into the 9 or 20 EMA before the entry
- Check the whole-rand or half-rand level (16.00, 16.50, 17.00) the pair is reacting to
- Confirm the chart is trending, not a risk-sentiment-driven spike
- Confirm the tick volume on the pullback is light, not heavy selling
- Read the bear case and invalidation before you size the position
- Skip C-grade rand setups where the reward is not there
Head to head
SnapPChart vs a general AI chat assistant for chart screenshots
Most traders land here after pasting a chart into a general AI tool and getting a vague description. Here is how a purpose-built screenshot grader compares for the last decision before you risk money.
| Feature | SnapPChart | General AI chat assistant |
|---|---|---|
| Reads any chart screenshot | Every upload | Inconsistent |
| Setup grade (A+ to F) | Yes | No |
| Entry, stop, and targets | Every upload | Varies by prompt |
| Same criteria every time | Fixed methodology | Varies by prompt |
| Multi-target exit plan (T1 / T2) | Yes | Rarely consistent |
| Risk/reward + invalidation | Yes | Inconsistent |
| Speed to a decision | Seconds | Prompting required |
| Grade history to review | Yes | No |
Keep Learning the Setup
Use these guides to understand how SnapPChart grades the trade instead of taking the output blindly.
What do traders ask about USD/ZAR Chart Analysis?
How SnapPChart grades a USD/ZAR chart from a screenshot.
How do I analyze a USD/ZAR chart with AI?
Screenshot the USD/ZAR chart from your platform and upload the image to SnapPChart. A multimodal vision model reads the structure, the pullback into the 9 and 20 EMA, the round-number levels, and visible tick volume directly from the picture, then returns a setup grade, an entry, a structural stop, targets, and the reward against the risk. You do not type out what the chart shows or connect a data feed.
Does it read live USD/ZAR prices, SARB, or gold and platinum prices?
No. SnapPChart grades the USD/ZAR chart screenshot you upload, not a live feed. It does not read live USD/ZAR prices, does not read the South African Reserve Bank's (SARB) rate-decision calendar, does not read gold or platinum-group-metals prices or other commodity data, does not read risk-sentiment or emerging-market flow data, and does not cross-reference other pairs. South Africa's status as a major gold and platinum exporter, and the rand's pull as a liquid emerging-market risk proxy, are trader background context, not something the grader reads. It reads the structure, the EMA pullback, the round numbers, and the tick volume that are visible in the image and returns the trade plan and the bear case. You stay the decision-maker.
Why does the commodity-exporter angle matter for grading USD/ZAR?
South Africa is a major exporter of gold and platinum-group metals, so the rand carries a real, if imperfect, correlation to metals prices and broader commodity-currency behavior on top of being one of the most actively traded emerging-market currencies globally. That combination means USD/ZAR can move harder and faster than a G7 pair on the same catalyst. Reading a clean trending pullback versus a sentiment-driven spike off the chart is half the job, and the grader rewards the former and marks down the latter. The consistency of the same structured fields on every chart lets you compare one rand setup to the next.
Why does the London session matter for grading USD/ZAR?
USD/ZAR is most actively traded during the London session and the London-New-York overlap, since South African business hours line up closely with Europe's, then tends to quiet down in the Asian session. Reading a clean trending pullback during the active window versus a quieter-session chop is part of the read, and the grader looks for the former, not the latter.
Are the entry, stop, and targets in pips or rand terms?
Rand terms. USD/ZAR is quoted to 2 decimals, roughly 16 to 17 rand per dollar, not the 4-decimal pip convention of a G7 major like USD/CAD or EUR/USD. The entry, structural stop, and targets are returned as rand prices such as 16.85, and the reward is measured against the risk on that same 2-decimal scale. The grader looks for a minimum reward-to-risk that holds up after spread on a liquid emerging-market major like the rand.
Can it grade a USD/ZAR short setup?
SnapPChart is optimized for long (buy) momentum setups. Short setups, options, and hedging are out of scope by design. On a higher-beta pair that swings both ways, the honest answer is that the grader is tuned for the long side, so use it for the long pullback setups it understands well.
Is USD/ZAR a free-floating, liquid pair?
Yes. USD/ZAR is a genuinely free-floating, exchange-traded major with deep liquidity, one of the most actively traded emerging-market currencies globally, not a pegged or thinly-traded currency, so there is no intervention or peg risk to caveat the way there would be on a managed currency. It carries the same confidence level as any other major FX pair on SnapPChart, with the caveat that it is higher-beta and can move harder than a G7 cross on the same catalyst.
Is USD/ZAR chart analysis free to try?
Yes. New users get two lifetime chart analyses, no credit card required. The first analysis shows the full depth so you can see exactly what the AI returns from a USD/ZAR chart; the second is gated to show what the paid product adds.
Grade your next USD/ZAR setup before you enter.
Upload the rand chart from the homepage and get a structured read on the USD/ZAR setup in seconds. No credit card required.
Grade a USD/ZAR Chart Free