Grade your silver setup before this fast metal whipsaws you.
Upload a silver or XAG/USD chart screenshot and SnapPChart reads the structure, the prior swing highs and lows the metal is reacting to, the round-number levels silver respects (the whole-dollar figures and the $0.50 half-dollar increments around them), and the visible volume, then returns a setup grade, entry, stop, targets, and the reward against the risk. Built for the faster, harder-swinging half of the precious-metals pair, whether you chart it as XAG/USD, the SI futures on COMEX, the SLV physical ETF, or alongside gold.
Drag and drop your chart screenshot
or click to browse. PNG, JPG, or WebP.
Your first analysis is free. No credit card.
Make sure both the time axis (X) and price axis (Y) are visible in your screenshot for accurate results.
Grade
B+
Entry
$3.87
Stop
$3.75
Target
$4.24
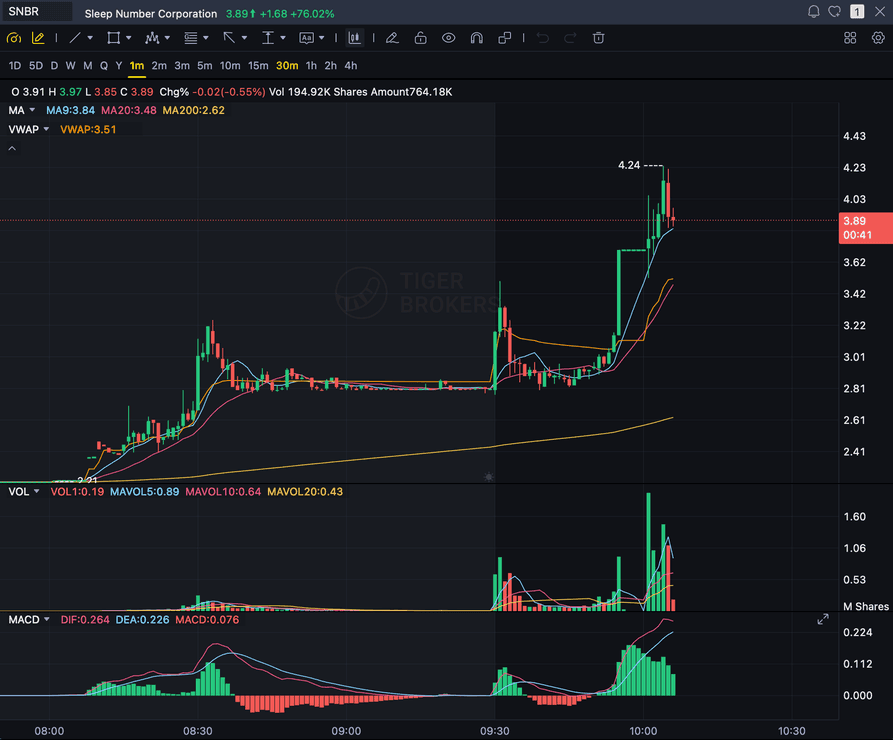
Format example (stock chart)
SNBR 1m bull flag pullback: strong opening momentum, lighter-volume consolidation, and a late breakout attempt near 3.89. Forex, crypto and futures screenshots get the same structure: a grade, entry, structural stop and targets.
XAG/USD
Spot silver against the US dollar
SI
Silver futures on COMEX
SLV
The physical silver ETF setups
XAU/USD
Gold when traded alongside silver
Quick answer
How do you analyze a silver chart with AI?
You screenshot the silver or XAG/USD chart from your platform and upload the image. SnapPChart reads it directly, the market structure, the prior swing highs and lows, the round-number levels silver tends to respect (the whole-dollar figures and the $0.50 half-dollar increments around them), and the visible volume, then grades the setup A+ to F with an entry, a structural stop, multi-target exits, and the reward against the risk. Silver moves a bigger percentage than gold on a given day and reverses harder, so a stop sized like a gold trade often gets clipped on silver's noise, and reading the round-number behaviour at the whole-dollar and half-dollar levels off the chart is a real edge. Industrial demand from solar panels and electronics, mine supply, the gold-to-silver ratio, and any precious-metals risk mood are trader background context, the things you know before you sit down, not data the grader reads. The grader works the same whether you chart it as XAG/USD (spot), SI (COMEX futures), SLV (the physical ETF), or watch it next to XAU/USD gold, because it reads the picture, not the ticker. It does not read live silver prices, does not pull the gold-to-silver ratio off any feed, does not read industrial-demand or supply reports or any news, does not read the economic calendar, and does not cross-reference other instruments such as gold or platinum. It grades what is visible on the chart you upload, using the same criteria every time, so you can compare one silver setup to the next instead of trading on feel.
What the AI Returns From a Screenshot
Use the output as a repeatable pre-trade checkpoint, not a prediction.
A-F Setup Grade
See whether the setup has enough pattern clarity, momentum, volume, and reward to justify the risk.
Entry, Stop, Targets
Get a structured trade plan with entry zone, invalidation level, targets, and risk/reward.
Screenshot-Based Read
Use charts from TradingView, Webull, ThinkOrSwim, MetaTrader, Robinhood, or any broker.
Risk Notes First
The analysis flags extension, messy chop, weak retests, thin reward, and conflicting indicators.
Workflow
Use it as a pre-entry gate on every silver setup
Silver can look calm for an hour and then rip or reverse hard because it is thinner and faster than gold, and a gold-sized stop is a common way to get stopped out on the noise. SnapPChart gives you a consistent quality check on the silver chart before you commit.
- Grade a silver pullback or breakout before the entry
- Check the round-number level (the whole-dollar figure or the $0.50 increment) silver is reacting to
- Confirm the chart is trending against prior swing highs and lows, not chopping
- Confirm the volume on the move is real participation, not a thin drift
- Read the bear case and invalidation before you size the position
- Skip C-grade silver setups where the reward is not there
Head to head
Grading a silver chart with SnapPChart vs reading it by hand
Silver moves a bigger percentage than gold on most days and reverses harder, so a stop drawn like a gold trade often gets clipped. Traders who read both by hand tend to carry gold habits over. Grading the silver chart on its own structure keeps the stop where silver's noise ends.
| Feature | SnapPChart | Reading the chart by hand |
|---|---|---|
| Stop wider than a gold-style stop when silver's swings call for it | From the structure | Gold habits carry over |
| Reads the whole-dollar and $0.50 silver levels | When visible on chart | Usually spotted |
| Grades an XAG/USD, SI futures, or SLV chart the same way | Reads the picture | Fine if focused |
| Flags a silver move that has already stretched before entry | Every bear case | Easy to chase |
| T1 and T2 with reward against risk on every silver trade | Every upload | Rough estimate |
| Gold-to-silver ratio and industrial demand | Not in a screenshot | You bring it |
Keep Learning the Setup
Use these guides to understand how SnapPChart grades the trade instead of taking the output blindly.
What do traders ask about Silver Chart Analysis?
How SnapPChart grades a silver or XAG/USD chart from a screenshot.
How do I analyze a silver chart with AI?
Screenshot the silver or XAG/USD chart from your platform and upload the image to SnapPChart. A multimodal vision model reads the structure, the prior swing highs and lows, the round-number levels, and visible volume directly from the picture, then returns a setup grade, an entry, a structural stop, targets, and the reward against the risk. You do not type out what the chart shows or connect a data feed.
Does it read live silver prices, the gold-to-silver ratio, or the news?
No. SnapPChart grades the silver chart screenshot you upload, not a live feed. It does not read live silver prices, does not pull the gold-to-silver ratio off any feed, does not read industrial-demand or mine-supply reports or any news, does not read the economic calendar, and does not cross-reference other instruments such as gold or platinum. Solar and electronics demand, mine supply, and the gold-silver ratio are trader background context, not something the grader sees. It reads the structure, the swing highs and lows, the round numbers, and the volume that are visible in the image and returns the trade plan and the bear case. You stay the decision-maker.
Can it grade SI futures, the SLV ETF, and XAG/USD the same way?
Yes. The grader reads the chart image regardless of which instrument it is. Whether you chart silver as XAG/USD (spot), SI (COMEX futures), or SLV (the physical ETF), the structure, levels, and volume on the screenshot are what it grades. The prices and contract specs differ, but the pattern it reads off the picture is the same, so the structured fields you get back are consistent across all of them. Entry, stop, and targets come back in the asset's native price units.
Why do round numbers matter for grading silver?
Silver tends to respect whole-dollar figures and the $0.50 half-dollar increments around them, where buyers and sellers cluster orders. Reading whether price is reacting at one of those levels versus drifting in no-man's-land is half the work, and the grader rewards a clean trending move against the prior swing structure and marks down a setup that is really thin chop between levels. The consistency of the same structured fields on every chart lets you compare one silver setup to the next.
Why does silver need a wider stop than gold?
Silver is the faster, thinner half of the precious-metals pair. It commonly swings a bigger percentage than gold in a session and reverses harder, so a stop sized off gold's typical range often gets clipped on silver's ordinary noise. The grader factors the visible range and structure into the stop it returns, but the honest takeaway is to size for silver's own volatility, not gold's.
Does it factor in the London and New York sessions for silver?
Only when session context is visible on the chart. If the screenshot shows the London or New York hours where silver sees its cleanest participation, the grade weighs that. The grader does not read a live clock or a session feed, so it works from what the image shows, the structure, the levels, and the volume, not from an external calendar.
Can it grade a silver short setup?
SnapPChart grades long and short momentum-continuation setups from chart screenshots. Choose Long only, Short only, or Both sides in your trading profile. Both sides picks one direction from the chart.
Is silver chart analysis free to try?
Yes. New users get two lifetime chart analyses, no credit card required. The first analysis shows the full depth so you can see exactly what the AI returns from a silver chart; the second is gated to show what the paid product adds.
Grade your next silver setup before you enter.
Upload the silver chart from the homepage and get a structured read on the setup in seconds. No credit card required.
Grade a Silver Chart Free