Grade your copper setup before Dr. Copper turns on the news.
Upload a copper or HG futures chart screenshot and SnapPChart reads the structure, the prior swing highs and lows the metal is reacting to, the round-number levels copper respects (the whole-dollar figures and the $0.10 dime increments around them), and the visible volume, then returns a setup grade, entry, stop, targets, and the reward against the risk. Built for the industrial bellwether metal traders call Dr. Copper, whether you chart it as HG futures on COMEX or the CPER physical ETF.
Drag and drop your chart screenshot
or click to browse. PNG, JPG, or WebP.
Your first analysis is free. No credit card.
Make sure both the time axis (X) and price axis (Y) are visible in your screenshot for accurate results.
Grade
B+
Entry
$3.87
Stop
$3.75
Target
$4.24
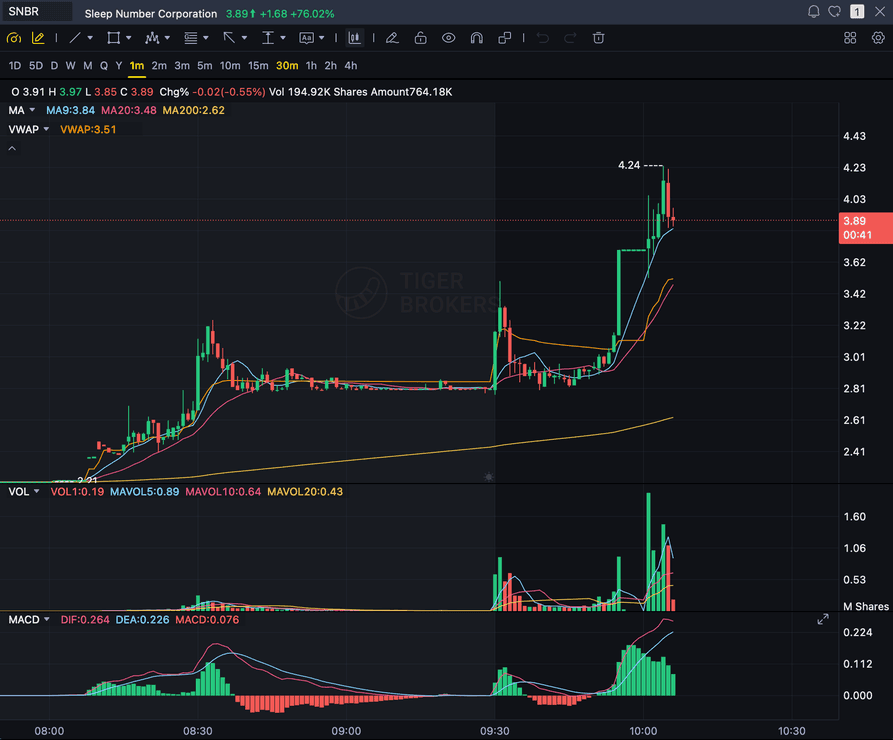
Format example (stock chart)
SNBR 1m bull flag pullback: strong opening momentum, lighter-volume consolidation, and a late breakout attempt near 3.89. Forex, crypto and futures screenshots get the same structure: a grade, entry, structural stop and targets.
HG
Copper futures on COMEX
CPER
The physical copper ETF setups
DR. COPPER
The industrial bellwether metal
ROUND NUMBERS
Whole-dollar and $0.10 levels copper respects
Quick answer
How do you analyze a copper chart with AI?
You screenshot the copper or HG futures chart from your platform and upload the image. SnapPChart reads it directly, the market structure, the prior swing highs and lows, the round-number levels copper tends to respect (the whole-dollar figures like $4.00 and $5.00, and the $0.10 dime increments around them), and the visible volume, then grades the setup A+ to F with an entry, a structural stop, multi-target exits, and the reward against the risk. Copper trades in a much lower price range than gold, platinum, or silver, typically a few dollars per pound, so its round numbers are whole dollars and dimes, not the big figures and half-dollar or fifty-dollar increments the other metals respect. Traders call it Dr. Copper because it is read as an economic bellwether: construction, electrical wiring, and EV demand, plus the pace of Chinese industrial activity, tend to show up in the copper chart before they show up anywhere else. That industrial-demand and macro-cyclical story, along with mine supply and the dollar, is trader background context, the things you know before you sit down, not data the grader reads. The grader works the same whether you chart it as HG (COMEX futures) or CPER (the physical ETF), because it reads the picture, not the ticker. It does not read live copper prices, does not pull Chinese manufacturing data (PMI) or any news, does not read the economic calendar, does not read the dollar index, and does not cross-reference other instruments. It grades what is visible on the chart you upload, using the same criteria every time, so you can compare one copper setup to the next instead of trading on feel.
What the AI Returns From a Screenshot
Use the output as a repeatable pre-trade checkpoint, not a prediction.
A-F Setup Grade
See whether the setup has enough pattern clarity, momentum, volume, and reward to justify the risk.
Entry, Stop, Targets
Get a structured trade plan with entry zone, invalidation level, targets, and risk/reward.
Screenshot-Based Read
Use charts from TradingView, Webull, ThinkOrSwim, MetaTrader, Robinhood, or any broker.
Risk Notes First
The analysis flags extension, messy chop, weak retests, thin reward, and conflicting indicators.
Workflow
Use it as a pre-entry gate on every copper setup
Copper can trend cleanly on real industrial demand and then whipsaw on a single Chinese PMI print or supply headline, and a setup that looks clean right before that kind of news is a classic trap. SnapPChart gives you a consistent quality check on the copper chart before you commit.
- Grade a copper pullback or breakout before the entry
- Check the round-number level (the whole-dollar figure or the $0.10 increment) copper is reacting to
- Confirm the chart is trending against prior swing highs and lows, not chopping
- Confirm the volume on the move is real participation, not a thin drift
- Read the bear case and invalidation before you size the position
- Skip C-grade copper setups where the reward is not there
Head to head
SnapPChart vs a general AI chat assistant for copper charts
Copper trades at a few dollars a pound, so its levels are whole dollars and dimes, not the big figures gold or silver respect. A chat tool will usually talk about Dr. Copper and China. SnapPChart grades the HG or CPER chart you upload and keeps the macro story out of the score.
| Feature | SnapPChart | General AI chat assistant |
|---|---|---|
| Reads copper's $4.00, $5.00, and $0.10 dime levels | When visible on chart | Rarely surfaced |
| Grades an HG futures or CPER chart on one standard | Reads the picture | Inconsistent |
| Stop and targets in cents per pound, scaled to copper's price | Every upload | Varies by prompt |
| Keeps the macro story out of a copper grade | Chart only | Leans on narrative |
| Bear case on a copper long or short | Every read | Inconsistent |
| Letter grade on every copper setup, same fixed scale | Fixed methodology | No fixed scale |
Keep Learning the Setup
Use these guides to understand how SnapPChart grades the trade instead of taking the output blindly.
What do traders ask about Copper Chart Analysis?
How SnapPChart grades a copper or HG futures chart from a screenshot.
How do I analyze a copper chart with AI?
Screenshot the copper or HG futures chart from your platform and upload the image to SnapPChart. A multimodal vision model reads the structure, the prior swing highs and lows, the round-number levels, and visible volume directly from the picture, then returns a setup grade, an entry, a structural stop, targets, and the reward against the risk. You do not type out what the chart shows or connect a data feed.
Does it read live copper prices, Chinese PMI data, or the news?
No. SnapPChart grades the copper chart screenshot you upload, not a live feed. It does not read live copper prices, does not pull Chinese manufacturing data (PMI) or mine-supply reports or any news, does not read the economic calendar, does not read the dollar index, and does not cross-reference other instruments. Construction and EV demand, Chinese industrial activity, and mine supply are trader background context, not something the grader sees. It reads the structure, the swing highs and lows, the round numbers, and the volume that are visible in the image and returns the trade plan and the bear case. You stay the decision-maker.
Can it grade HG futures and the CPER ETF the same way?
Yes. The grader reads the chart image regardless of which instrument it is. Whether you chart copper as HG (COMEX futures) or CPER (the physical ETF), the structure, levels, and volume on the screenshot are what it grades. The prices and contract specs differ, but the pattern it reads off the picture is the same, so the structured fields you get back are consistent across both. Entry, stop, and targets come back in the asset's native price units.
Why do round numbers matter for grading copper, and why are they different from gold or silver?
Copper trades at a much lower price scale than the precious metals, typically a few dollars per pound, so it respects whole-dollar figures like $4.00 and $5.00 and the $0.10 dime increments around them, not the big figures and $50 or $0.50 increments that gold, platinum, and silver respect. Reading whether price is reacting at one of those dollar or dime levels versus drifting in no-man's-land is half the work, and the grader rewards a clean trending move against the prior swing structure and marks down a setup that is really thin chop between levels. The consistency of the same structured fields on every chart lets you compare one copper setup to the next.
Why is copper called Dr. Copper, and does that affect the grade?
Copper earned the nickname Dr. Copper because it is used everywhere in construction, electrical wiring, and increasingly EVs, so its price is watched as an early read on industrial demand and global economic health, especially out of China. That is a different character from gold, silver, or platinum, which trade more on safe-haven and precious-metal demand. The grader does not price in the macro story; it only reads the structure, levels, and volume visible on the chart. The Dr. Copper reputation is context for why the metal moves, not something the grader factors into the number it returns.
Does it factor in the London and New York sessions for copper?
Only when session context is visible on the chart. If the screenshot shows the London or New York hours where copper sees its cleanest participation, the grade weighs that. The grader does not read a live clock or a session feed, so it works from what the image shows, the structure, the levels, and the volume, not from an external calendar.
Can it grade a copper short setup?
SnapPChart grades long and short momentum-continuation setups from chart screenshots. Choose Long only, Short only, or Both sides in your trading profile. Both sides picks one direction from the chart.
Is copper chart analysis free to try?
Yes. New users get two lifetime chart analyses, no credit card required. The first analysis shows the full depth so you can see exactly what the AI returns from a copper chart; the second is gated to show what the paid product adds.
Grade your next copper setup before you enter.
Upload the copper chart from the homepage and get a structured read on the setup in seconds. No credit card required.
Grade a Copper Chart Free