Grade your NQ setup before you take the trade.
Upload an NQ (E-mini Nasdaq 100 futures) chart screenshot and SnapPChart reads the structure, the levels the contract respects, and the EMA pullback context, then returns a setup grade, entry, stop, targets, and the reward against the risk. Works the same on the MNQ micro.
Drag and drop your chart screenshot
or click to browse. PNG, JPG, or WebP.
Your first analysis is free. No credit card.
Make sure both the time axis (X) and price axis (Y) are visible in your screenshot for accurate results.
Market
NQ
Chart
15m
Read
Reversal
Risk
Overhead
NQ readout
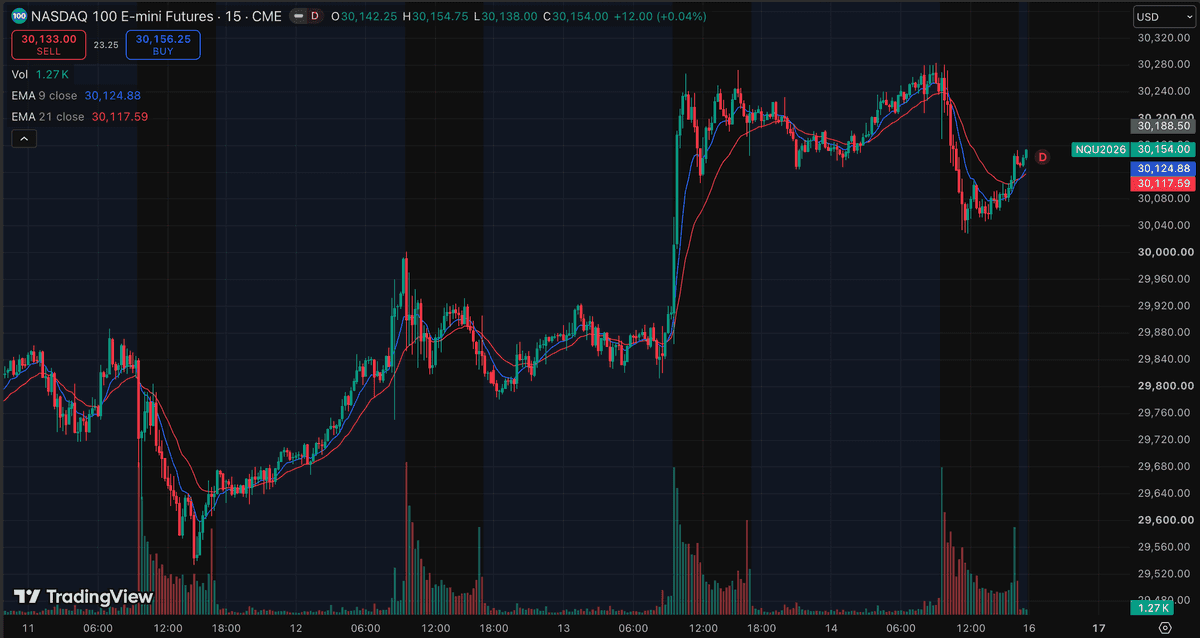
NQ sample readout: a sharp increase in buying volume off 29,860 is followed by a higher high at 30,285, a structure shift that turns the trend up. On the right edge the 9 EMA has crossed above the 21 EMA, a bullish crossover confirming the momentum shift. Concern: the 30,150 shelf that held as support through the prior session broke on the selloff and now sits overhead as resistance, so an entry at 30,154 is directly under the level that has to clear first.
NQ
E-mini Nasdaq 100 futures, plus the MNQ micro
LEVELS
Prior highs, lows, and round numbers the contract respects
EMA
Pullback and reclaim context on the futures chart
R:R
Reward measured against a structural stop
Quick answer
How do you analyze an NQ chart with AI?
You screenshot the NQ chart from your platform and upload the image. SnapPChart reads it directly, the market structure, the levels the contract keeps reacting to, the EMA pullback context, and the visible volume, then grades the setup A+ to F with an entry, a structural stop, multi-target exits, and the reward against the risk.
NQ is the CME E-mini Nasdaq 100 futures contract, quoted per contract rather than as an index level, and platforms label the same thing NQ, NQ1!, /NQ, or a dated code like NQU2026, with MNQ as the micro. Each 0.25-point tick on NQ is worth $5, or $20 a point, against $0.50 a tick and $2 a point on MNQ. The grade quotes risk in chart points, so turning a stop into dollars per contract stays with you. The contract trades on CME Globex from Sunday evening to Friday afternoon with a one-hour daily break, and the front month rolls about a week before the third-Friday expiry in March, June, September, and December. It does not read live quotes, does not pull the economic calendar, and does not see order flow or the DOM. It grades what is visible on the chart you upload, using the same criteria every time, so you can compare one NQ setup to the next instead of trading on feel.
What the AI Returns From a Screenshot
Use the output as a repeatable pre-trade checkpoint, not a prediction.
A-F Setup Grade
See whether the setup has enough pattern clarity, momentum, volume, and reward to justify the risk.
Entry, Stop, Targets
Get a structured trade plan with entry zone, invalidation level, targets, and risk/reward.
Screenshot-Based Read
Use charts from TradingView, Webull, ThinkOrSwim, MetaTrader, Robinhood, or any broker.
Risk Notes First
The analysis flags extension, messy chop, weak retests, thin reward, and conflicting indicators.
Workflow
Use it as a pre-entry gate on every NQ setup
NQ moves fast and the overnight session hands you a chart that already ran before the cash open. SnapPChart gives you a consistent quality check on the contract chart before you commit.
- Grade an NQ breakout or pullback before the entry
- Check the prior high or round number the contract is reacting to
- Confirm the EMA pullback context supports the long
- Read the bear case and invalidation before you size up
- Re-grade the chart after a pullback to see if the setup got cleaner
- Skip C-grade setups where the reward is not there
Head to head
SnapPChart vs a general AI chat assistant for NQ chart analysis
General AI tools can describe an NQ chart, but they will not return the same structured fields twice, and they treat a 15-minute E-mini screenshot the same as any other picture. SnapPChart grades every NQ setup to one standard, the front-month contract or the MNQ micro, so an overnight range break and a cash-open pullback are scored on the same scale.
| Feature | SnapPChart | General AI chat assistant |
|---|---|---|
| Reads NQ, MNQ, NQ1!, and /NQ chart screenshots | Yes, every upload | Inconsistent |
| Grades the same whether the screenshot is an overnight or cash session | One standard | Varies by prompt |
| Setup grade (A+ to F) | Yes | No |
| Entry, stop, and multi-target exits | Every upload | Varies by prompt |
| Flags an already-extended NQ move before you chase it | Every bear case | Rarely surfaced |
| Reads live order flow, the DOM, or the economic calendar | No, screenshot only | No |
| Grade history to review | Yes | No |
Keep Learning the Setup
Use these guides to understand how SnapPChart grades the trade instead of taking the output blindly.
What do traders ask about NQ Chart Analysis?
How SnapPChart grades an E-mini Nasdaq 100 futures chart from a screenshot.
How do I analyze an NQ chart with AI?
Screenshot the NQ chart from your platform and upload the image to SnapPChart. A multimodal vision model reads the structure, the levels, the EMA pullback context, and the visible volume directly from the picture, then returns a setup grade, an entry, a structural stop, targets, and the reward against the risk. You do not type out what the chart shows or connect a data feed.
What is the difference between NQ, MNQ, NAS100, and QQQ?
They track the same Nasdaq 100 index through four different wrappers. NQ is the CME E-mini futures contract, quoted per contract, and MNQ is the micro at a tenth of the size. NAS100 (also sold as US Tech 100 or USTEC) is the index CFD most brokers offer. QQQ is the ETF that trades in cash-equity hours. The charts look similar but the sessions and the quoted numbers do not match, so upload the one you actually trade. SnapPChart grades any of them from a screenshot, and we keep a separate page for the NAS100 CFD and the QQQ ETF.
Does it read live NQ data, order flow, or the economic calendar?
No. SnapPChart grades the NQ chart screenshot you upload, not a live feed. It does not see the DOM, order flow, or the footprint, does not pull the economic calendar, does not know which contract month is about to roll, and does not predict the next candle. It reads the structure, the levels, and the EMA context visible in the image and returns the trade plan and the bear case. You stay the decision-maker.
Does it handle overnight NQ charts as well as the cash session?
Yes, because it grades what the screenshot shows. NQ trades nearly around the clock, so an overnight chart often arrives at the cash open having already made its move. The grader applies the same criteria to both, which is the point: an overnight range break and a mid-morning pullback come back scored on one scale instead of on your read of how the session felt.
Can I upload an MNQ chart instead?
Yes. MNQ is the micro version of the same contract and the chart structure is the same, so upload whichever one you trade. The grade, entry, stop, and targets come off the price levels visible in your screenshot, so they will be quoted on the scale of the chart you uploaded.
How much is an NQ tick worth, and does the grade use it?
An NQ tick is 0.25 index points and is worth $5, so a full point is $20. On MNQ the same tick is $0.50 and a point is $2. SnapPChart quotes the entry, stop, and targets as price levels from your screenshot, not in ticks or dollars, and it does not know your account size or margin. So a 20-point stop is $400 per NQ contract and $40 per MNQ, and that conversion is yours to do before you size the trade.
Which NQ contract month should I screenshot?
The front month, which is what continuous symbols like NQ1! show. Dated codes run NQH, NQM, NQU, and NQZ for March, June, September, and December, and volume moves to the next contract about a week before the third-Friday expiry. SnapPChart does not track which month you are viewing or when it rolls, so if you trade the new contract during roll week, screenshot that one.
Can it grade an NQ short setup?
SnapPChart grades long and short momentum-continuation setups from chart screenshots. Choose Long only, Short only, or Both sides in your trading profile. Both sides picks one direction from the chart.
Is NQ chart analysis free to try?
Yes. New users get two lifetime chart analyses, no credit card required. The first analysis shows the full depth so you can see exactly what the AI returns from an NQ chart; the second is gated to show what the paid product adds.
Grade your next NQ setup before you enter.
Upload the E-mini chart from the homepage and get a structured read on the NQ setup in seconds. No credit card required.
Grade an NQ Chart Free