Grade your NFLX setup before you take the trade.
Upload an NFLX (Netflix, Inc.) chart screenshot and SnapPChart reads the structure, key levels, EMA/VWAP pullback context, and visible volume, then returns a setup grade, entry, stop, targets, and the reward against the risk. Built for the traders who actually watch this chart every session: day traders, swing traders, and weekly or monthly options traders using Netflix's stock chart to time an entry around one of the most heavily traded, most heavily followed mega-cap streaming and media names on the market.
Drag and drop your chart screenshot
or click to browse. PNG, JPG, or WebP.
Your first grade is free, no card: it shows the setup's grade and the general read. Entry, stop, targets and the trade plan come with a paid plan.
Make sure both the time axis (X) and price axis (Y) are visible in your screenshot for accurate results.
Grade
B+
Entry
$3.87
Stop
$3.75
Target
$4.24
Format example (stock chart)
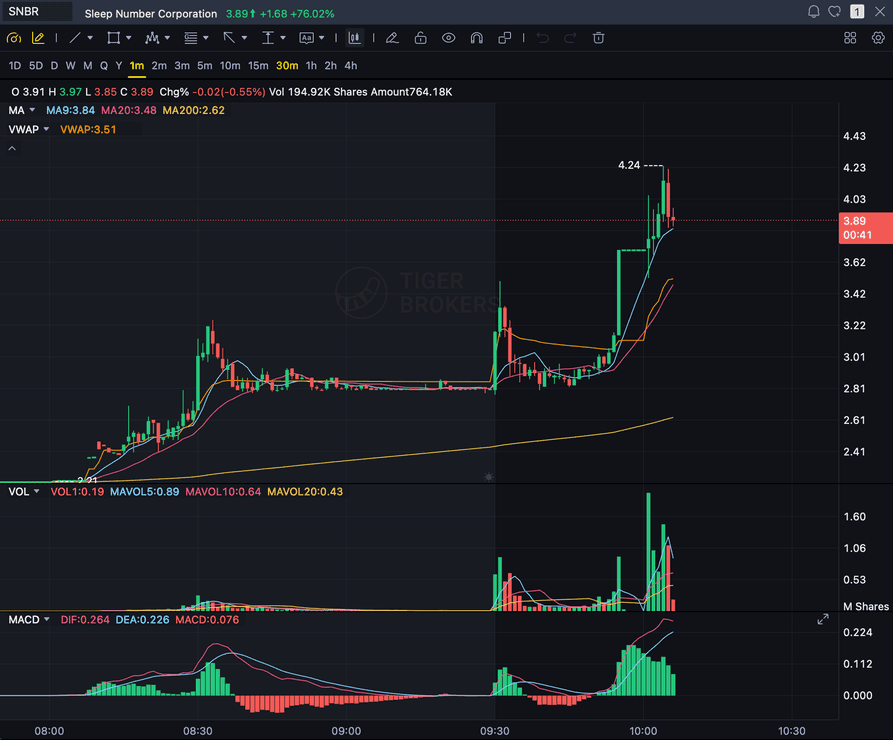
SNBR 1m bull flag pullback: strong opening momentum, lighter-volume consolidation, and a late breakout attempt near 3.89. Forex, crypto and futures screenshots get the same structure: a grade, entry, structural stop and targets.
NFLX
Netflix, Inc. chart setups on Nasdaq
WEEKLY / MONTHLY OPTIONS
The underlying chart setup options traders time entries on
STREAMING / MEDIA
One of the most heavily traded mega-cap streaming and media names
ENTRY / STOP / TARGETS
Structured trade plan with the reward measured against the risk
Quick answer
How do you analyze an NFLX chart with AI?
You screenshot the NFLX chart from your broker or TradingView and upload the image. SnapPChart reads it directly, the market structure, the key levels, the EMA or VWAP pullback context, and the visible volume, then grades the setup A+ to F with an entry, a structural stop, multi-target exits, and the reward against the risk. NFLX is Netflix, Inc., listed on the Nasdaq, one of the most heavily traded and most heavily followed mega-cap streaming and media stocks on the market, with an active weekly and monthly listed options chain that day and swing traders lean on for short-dated plays. Netflix completed a 10-for-1 stock split on November 17, 2025, which changed the per-share price scale without changing the underlying business, so a chart that does not auto-adjust for it will show a large gap at that date. Unlike a diversified index ETF, a single-company chart like NFLX carries single-stock risk, and it is historically volatile around its own quarterly earnings print, since subscriber-growth numbers and the newer ad-supported tier's traction can move it sharply on news that has nothing to do with the broader tech tape. SnapPChart does not read a live NFLX price feed, does not know Netflix's earnings dates or EPS actuals, does not read the options chain, open interest, implied volatility, or greeks, does not pull analyst ratings or price targets, does not track insider trading data, and does not read subscriber-growth figures, content-slate performance, or ad-supported-tier ad-revenue metrics. It grades what is visible on the chart you upload, using the same criteria every time, so a day trader or swing trader can compare one NFLX setup to the next instead of trading on feel.
What the AI Returns From a Screenshot
Use the output as a repeatable pre-trade checkpoint, not a prediction.
A-F Setup Grade
See whether the setup has enough pattern clarity, momentum, volume, and reward to justify the risk.
Entry, Stop, Targets
Get a structured trade plan with entry zone, invalidation level, targets, and risk/reward.
Screenshot-Based Read
Use charts from TradingView, Webull, ThinkOrSwim, MetaTrader, Robinhood, or any broker.
Risk Notes First
The analysis flags extension, messy chop, weak retests, thin reward, and conflicting indicators.
When to use it
Use it as a pre-entry gate on every NFLX setup
NFLX is one of the most heavily traded mega-cap streaming stocks on the market, and an earnings print or a subscriber-growth headline can turn a clean-looking chart choppy fast. SnapPChart gives you a consistent quality check on the stock chart before you commit.
- Grade an NFLX breakout or pullback before the entry
- Check the key level and prior high or low Netflix's chart is reacting to
- Confirm the EMA/VWAP pullback context supports the setup before you size in
- Cross-check an NFLX setup against AMZN, QQQ, or the broader mega-cap tech tape
- Re-grade the chart after an earnings print or a major subscriber-growth headline before trusting an older read
- Account for the November 2025 10-for-1 split when comparing pre-split chart history so old levels aren't read at the wrong scale
- Skip C-grade NFLX setups where the reward is not there
Netflix (NFLX) headlines
Latest Netflix (NFLX) news
Recent NFLX stories from Yahoo Finance and Google News. Use the news read alongside your chart grade before sizing into a position.
Netflix shares under pressure as chief content officer departs
Netflix Inc (NASDAQ:NFLX, XETRA:NFC) Chief Content Officer Bela Bajaria is leaving the streaming company after a 10-year run, with Disney veteran Peter Rice confirmed as her replacement, a day after…
Netflix Taking Significant Steps to Address Engagement Issues, Wedbush Says
Netflix (NFLX) is making significant changes to address slowing viewer engagement and revive growth,
Meta, Tesla, SpaceX Take Center Stage As Earnings Season Kicks Into High Gear. Everything You Need To Know.
Meta Platforms and Tesla earnings will highlight a big week of reports, including Netflix, defense, software and chip names.
Netflix stock plunges 25% as media giant shakes up leadership
Netflix (NFLX) is down 25% year-to-date, and the media giant is now shaking up its top brass. The 8:30 panel discusses the leadership transition and the difficulty of investing in…
Netflix Hires Former Disney Exec to Fix Content Problem. Why the Stock Is Falling.
The streamer is changing up its leadership team—but that’s only drawing more attention to its biggest problem.
First Week of Q3 Earnings in the Books
The Dow looks to close higher for its second-straight week, while the Nasdaq hopes to avoid its worst trading week since July.
Head to head
SnapPChart vs a general AI chat assistant for NFLX chart analysis
General AI tools can describe an NFLX chart, but they will not return the same structured fields twice, and they are not built for the pullback and continuation reads that mega-cap streaming and media day and swing traders lean on before timing an entry. SnapPChart grades every NFLX setup, before or after the 2025 split, to the same standard so you can compare a breakout, a dip buy, and a retest on equal footing.
| Feature | SnapPChart | General AI chat assistant |
|---|---|---|
| Reads NFLX chart screenshots from any broker or platform | Yes, every upload | Inconsistent |
| Grades the momentum-continuation setup streaming and media mega-cap day and swing traders time entries on | Every setup | Not built for that decision |
| Setup grade (A+ to F) | Yes | No |
| Entry, stop, and multi-target exits | Every paid grade | Varies by prompt |
| Flags an already-extended NFLX move before you chase it | Every bear case | Rarely surfaced |
| Uses the same fixed grading criteria whether NFLX is trending on earnings or subscriber-growth news or quiet | Fixed methodology | Varies by prompt |
| Grade history to review | Yes, on paid plans | No |
Keep Learning the Setup
Use these guides to understand how SnapPChart grades the trade instead of taking the output blindly.
What do traders ask about NFLX Chart Analysis?
How SnapPChart grades an NFLX chart from a screenshot.
Can AI grade an NFLX chart screenshot?
Yes. Screenshot the NFLX chart from your broker or TradingView and upload the image to SnapPChart. A multimodal vision model reads the structure, key levels, EMA/VWAP pullback context, and visible volume directly from the picture, then returns a setup grade, an entry, a structural stop, targets, and the reward against the risk. You do not type out what the chart shows or connect a data feed.
Does SnapPChart read NFLX's live price, earnings dates, or options chain?
No. The grade is built entirely from what is visible in the screenshot you upload. SnapPChart does not pull a live NFLX price feed, does not know Netflix's earnings dates or EPS actuals, does not read the options chain, open interest, implied volatility, or greeks, does not pull analyst ratings, price targets, or insider trading data, and does not read subscriber-growth figures, content-slate performance, or ad-supported-tier ad-revenue metrics. The live Netflix headlines shown further down this page are a separate real news feed for you to read alongside the grade; the AI does not read those headlines or factor them into the grade itself. If a level or indicator is not on the chart, it is not part of the grade.
Does it work around Netflix earnings or subscriber-growth reports?
SnapPChart does not know Netflix's earnings calendar, and it does not read analyst estimates, EPS actuals, guidance, subscriber-growth figures, content-slate performance, or ad-supported-tier ad-revenue metrics. It grades whatever is visible on the chart screenshot you upload at the moment you upload it. NFLX is historically sensitive to its own quarterly earnings print and to subscriber-growth surprises, so a grade run the day before an earnings print can look very different once the numbers land. Re-upload a fresh screenshot once the news has printed rather than trusting an older read through a gap.
What does it look at on an NFLX chart?
When they are visible on the chart, it reads market structure, prior highs and lows, key support and resistance levels, EMA and VWAP pullback or reclaim context, and relative volume, then folds them into the grade. Show the levels and moving averages you trade with before you screenshot so the AI has the context that matters.
How is grading an NFLX chart different from grading AMZN, QQQ, or NAS100?
AMZN is a mega-cap with two somewhat independent business lines, e-commerce and cloud computing, while NFLX is a single-focus streaming and media company, so the same technical read on an NFLX chart carries more exposure to one narrative: subscriber growth, content-slate performance, and the newer ad-supported tier's traction. QQQ and NAS100 are diversified baskets of the largest Nasdaq companies, so a grade on either chart reflects broad index behavior instead of single-stock risk. SnapPChart grades whichever chart you upload the same way structurally, candles, levels, volume, entry, stop, targets, bear case, but if you actually hold NFLX shares or options, upload the NFLX chart itself rather than a basket or sibling-stock proxy so the price scale and single-stock risk match what you trade.
Can it grade an NFLX short setup?
SnapPChart grades momentum-continuation setups in both directions, long and short. What it does not do is call a reversal or a counter-trend turn: if a chart just topped and is rolling over, that is not a short setup for the grader, it is a long that is stopping out, and the same logic applies in reverse for a bottom. If you are trading a continuation move in an established NFLX downtrend, that is in scope; if you are trying to catch the exact top or bottom, that is not.
Is NFLX chart analysis free to try?
Yes. New accounts get one free grade. You see the setup's grade and the general read on your chart. Entry, stop, targets and the trade plan come with a paid plan. No card needed to try it. Upload an NFLX chart to see how it reads the setup.
Grade your next NFLX setup before you enter.
Upload the stock chart from the homepage and get a structured read on the NFLX setup in seconds. No credit card required.
Grade an NFLX Chart Free