Screenshot your Plus500 chart, get a graded trade plan back.
SnapPChart reads a Plus500 chart screenshot the way you do, the candles, the levels, and whatever indicators you have on the chart, then returns a setup grade, entry, stop, targets, and the main reason it could fail. No account link, no API, no plugin or add-on. It reads the picture you upload, so it grades the actual setup on your Plus500 WebTrader chart instead of touching your account.
STOCKS
Momentum, breakout, pullback, and reversal setups
FOREX
Major pairs, crosses, XAUUSD, and session context
CRYPTO
Bitcoin, Ethereum, and high-beta altcoin charts
FUTURES
Index, commodity, and intraday futures screenshots
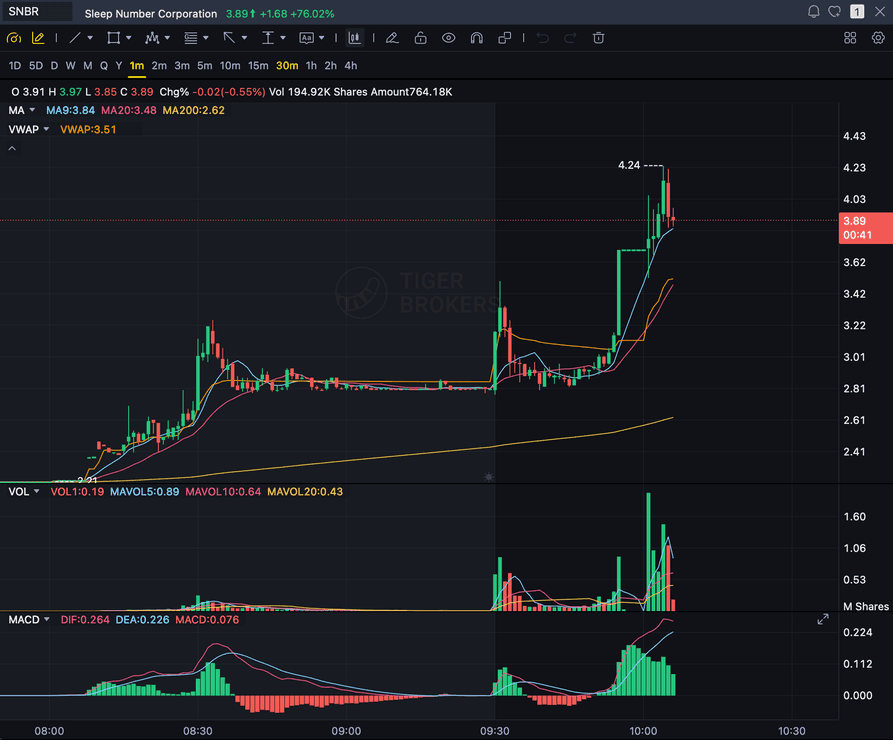
Grade
B+
Entry
$3.87
Stop
$3.75
Target
$4.24
Sample readout
SNBR 1m bull flag pullback: strong opening momentum, lighter-volume consolidation, and a late breakout attempt with the 3.89 price marker near the current candle.
Quick answer
How do you analyze a Plus500 chart with AI?
You screenshot the chart in Plus500 and upload the image. SnapPChart reads the screenshot directly, the candles, trend, support and resistance, volume, and any indicators you have on the chart, then grades the setup A+ to F with an entry, a structural stop, multi-target exits, and a bear case. Plus500 is an established multi-asset CFD broker that runs on its own WebTrader and app, with built-in charting that ships over 100 technical indicators and a deep set of drawing tools, so this is the fastest honest answer to which AI can read a Plus500 screenshot: you do not link your brokerage account, you do not connect an API, there is no plugin or add-on, and it does not route or place orders, read your live Plus500 or broker feed, scan the market, or predict the next candle, because the analyzer reads the picture, not your platform or a data feed. Plus500 uses its own proprietary platform rather than MetaTrader or a third-party charting engine, but that does not change anything here, because the analyzer reads the chart image, not the software. That also means it is platform-agnostic. The same upload works whether you chart in Plus500, MetaTrader, or TradingView, and the same grading checklist runs on every screenshot so a strong setup and a weak one get judged the same way.
What the AI Returns From a Screenshot
Use the output as a repeatable pre-trade checkpoint, not a prediction.
A-F Setup Grade
See whether the setup has enough pattern clarity, momentum, volume, and reward to justify the risk.
Entry, Stop, Targets
Get a structured trade plan with entry zone, invalidation level, targets, and risk/reward.
Screenshot-Based Read
Use charts from TradingView, Webull, ThinkOrSwim, MetaTrader, Robinhood, or any broker.
Risk Notes First
The analysis flags extension, messy chop, weak retests, thin reward, and conflicting indicators.
Workflow
From Plus500 screenshot to graded setup in one upload
You do not connect your account or rebuild the chart. Screenshot it in Plus500, drop the image in, and read the grade.
- Screenshot any symbol on any timeframe in Plus500 (WebTrader, desktop app, or mobile)
- Upload the image, with no account link, no API, and no plugin or add-on
- The analyzer reads candles, levels, volume, and the indicators visible on your chart
- Read the A+ to F grade, entry, stop, targets, and the bear case
- Take the A and B+ setups, skip the rest, and screenshot the next chart
Head to head
SnapPChart vs a general AI chat assistant for chart screenshots
Most traders land here after pasting a chart into a general AI tool and getting a vague description. Here is how a purpose-built screenshot grader compares for the last decision before you risk money.
| Feature | SnapPChart | General AI chat assistant |
|---|---|---|
| Reads any chart screenshot | Every upload | Inconsistent |
| Setup grade (A+ to F) | Yes | No |
| Entry, stop, and targets | Every upload | Varies by prompt |
| Same criteria every time | Fixed methodology | Varies by prompt |
| Multi-target exit plan (T1 / T2) | Yes | Rarely consistent |
| Risk/reward + invalidation | Yes | Inconsistent |
| Speed to a decision | Seconds | Prompting required |
| Grade history to review | Yes | No |
Keep Learning the Setup
Use these guides to understand how SnapPChart grades the trade instead of taking the output blindly.
Plus500 Chart Analysis FAQ
How the AI reads a Plus500 screenshot and what it returns.
How do I analyze a Plus500 chart with AI?
Screenshot the chart in Plus500, then upload the image to SnapPChart. A multimodal vision model reads the candles, trend, support and resistance, volume, and any visible indicators directly from the picture, then returns a setup grade, an entry, a structural stop, targets, and the main reason the trade could fail. You do not type out what the chart shows or connect your Plus500 account.
Is SnapPChart a Plus500 plugin or account integration?
No. There is nothing to install, no API to connect, and no brokerage account to link. SnapPChart reads the screenshot you upload, so it works with Plus500 without being part of it. That is on purpose: reading the image instead of your platform or a data feed is what lets the same tool grade a chart from Plus500, MetaTrader, TradingView, or any other platform.
Does it work with the Plus500 WebTrader charts?
Yes. Plus500 runs on its own proprietary WebTrader and app rather than MetaTrader or a third-party charting engine, but that does not change anything because the analyzer reads the chart image, not the charting software. Capture the chart on the Plus500 WebTrader, the desktop app, or mobile, upload the screenshot, and the same grading checklist runs on it.
What instruments can I analyze from a Plus500 chart?
Plus500 offers CFDs across forex, indices, commodities, shares, crypto, ETFs, and options, plus a separate futures product, so the price charts you screenshot for any of those are in scope as long as the candles, timeframe, and price scale are visible. The grader reads the price chart you are basing the trade on, not an instrument list, so screenshot the actual setup you want graded.
Does it read the indicators on my Plus500 chart?
It reads the indicators that are visible in the screenshot. Plus500 charting ships with a large library of technical indicators and drawing tools, and if you have moving averages, VWAP, MACD, RSI, or volume showing on the chart, the analyzer factors what it can see into the grade. It cannot read an indicator you have hidden or a setting that is not shown, because it only has the picture. Show the levels you care about before you screenshot.
Is Plus500 chart analysis free to try?
Yes. New users get two lifetime chart analyses, no credit card required. The first analysis shows the full depth so you can see exactly what the AI returns from a Plus500 screenshot; the second is gated to show what the paid product adds.
Does it place trades or predict where price goes next?
No. It is a pre-trade decision layer, not an autonomous trader and not a price predictor. It grades the setup in the screenshot so your process stays repeatable. It does not connect to Plus500, does not route or place orders, does not read your live Plus500 or broker feed, does not scan the market, and does not call the next candle. You stay the decision-maker.
Explore more AI chart analysis pages
Grade setups across more markets, platforms, and strategies with the same AI workflow.
Grade your next Plus500 chart.
Screenshot a chart in Plus500, upload it from the homepage, and get a graded trade plan in seconds. No account link and no credit card required.
Analyze a Plus500 Chart Free