Grade the bull pennant before you chase the breakout.
Upload a chart with a bull pennant forming and get a read on the flagpole, how tightly the converging consolidation pinched in, the breakout level, the volume behind the move, and a full trade plan, so a clean pennant and a sloppy one do not get the same benefit of the doubt.
FLAGPOLE
The sharp impulse leg up, as drawn on your chart
PENNANT
How tightly the converging triangle pinched in
VOLUME
Whether volume dried up into the apex and returned on the break
9 EMA
Trend context the pennant is riding above
Grade
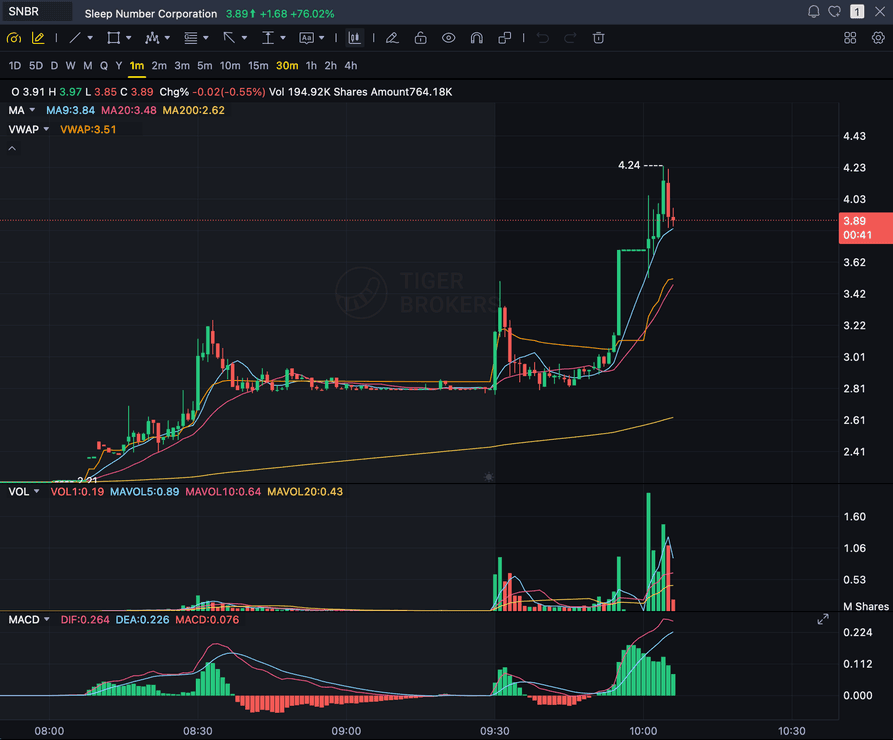
B+
Entry
$3.87
Stop
$3.75
Target
$4.24
Sample readout
SNBR 1m bull flag pullback: strong opening momentum, lighter-volume consolidation, and a late breakout attempt with the 3.89 price marker near the current candle.
Quick answer
What is a bull pennant, and can AI grade it?
A bull pennant is a continuation pattern: a sharp impulse move up (the flagpole), followed by a short, tight consolidation where the range converges into a small symmetrical triangle on lighter volume (the pennant), then a breakout that resumes the uptrend. It is a close cousin of the bull flag and differs only in the shape of the pause: a flag drifts down inside a small parallel channel, while a pennant pinches in between two converging trendlines toward an apex. SnapPChart grades that exact structure from the chart you upload: it reads the flagpole, how tight and symmetrical the converging consolidation is, the upper-trendline breakout level, the 9 and 20 EMA context, and the volume behind the move, then returns a setup grade, an entry zone, a structural stop below the pennant, multi-target exits, and the bear case. The measured-move target often mirrors the flagpole height. It reads the image you upload, not a live feed, and it does not watch the tape or predict the next candle. You mark the pennant, screenshot the chart, and upload it, and the same checklist runs every time so a tight pennant and a wide, messy one get judged the same way.
What the AI Returns From a Screenshot
Use the output as a repeatable pre-trade checkpoint, not a prediction.
A-F Setup Grade
See whether the setup has enough pattern clarity, momentum, volume, and reward to justify the risk.
Entry, Stop, Targets
Get a structured trade plan with entry zone, invalidation level, targets, and risk/reward.
Screenshot-Based Read
Use charts from TradingView, Webull, ThinkOrSwim, MetaTrader, Robinhood, or any broker.
Risk Notes First
The analysis flags extension, messy chop, weak retests, thin reward, and conflicting indicators.
Workflow
Use it as a quality check on the pennant
Plenty of bull pennants fail on a low-volume breakout or when the consolidation drifted too wide instead of converging cleanly. SnapPChart gives you a consistent read on whether this one is tight and ready before you chase the break.
- Mark the flagpole and the converging pennant, then screenshot the chart as it nears the breakout
- Check whether the consolidation pinched into a tight symmetrical triangle instead of drifting wide
- Confirm volume dried up into the apex and is returning on the breakout
- Read the 9 EMA and 20 EMA context the pennant is riding above
- Re-grade after the breakout to see if the upper trendline held or it was a fakeout
- Skip the pennant when the grade flags a deep, wide consolidation or thin breakout volume
Head to head
SnapPChart vs a general AI chat assistant for bull pennant setups
A general AI tool can tell you a chart looks like a bull pennant, but it will not judge the quality of the pennant to the same standard twice. SnapPChart checks the flagpole, how tightly the converging consolidation pinched in, the breakout level, and the volume the same way on every screenshot you upload.
| Feature | SnapPChart | General AI chat assistant |
|---|---|---|
| Grades the bull pennant you marked on the screenshot | Yes, every upload | Inconsistent |
| Reads the flagpole and the converging pennant consolidation | From the image | Varies by prompt |
| Checks volume drying up into the apex vs the breakout | Every grade | Rarely |
| Flags a pennant that drifted too wide or retraced too deep | Every bear case | Rarely flagged |
| Entry, stop, targets off the upper trendline breakout | Yes | Prompting required |
| Same criteria on every pennant | Fixed methodology | Varies by session |
Learn the bull pennant setup
Use these guides to understand what makes a pennant grade well, so you take the read instead of the output blindly.
Bull Pennant AI FAQ
How SnapPChart grades a bull pennant from your screenshot.
How does the AI grade a bull pennant?
It reads the flagpole you marked, how tight and symmetrical the converging consolidation is, the upper-trendline breakout level, and whether price is breaking out or still pinching inside the pennant. It factors the 9 and 20 EMA position and the volume behind the move into the grade, then returns a setup grade, an entry, a structural stop below the pennant, and targets. A tight pennant that converged on drying-up volume grades higher than a wide, sloppy consolidation that gave back most of the pole.
Does SnapPChart auto-detect or scan for bull pennants, or read live price?
No. It does not scan a feed for pennants, watch the tape, or predict the next candle. You identify and mark the bull pennant, then screenshot and upload that chart, and the AI grades the structure it can see in the image: the flagpole, the converging consolidation, the breakout level, the EMAs, and the volume. The grade reflects the picture you give it.
How is a bull pennant different from a bull flag, and does the AI treat them the same way?
Both are momentum-continuation patterns built off a flagpole, and the engine grades both as a long that resumes the uptrend. The difference is the shape of the pause: a bull flag drifts down inside a small parallel channel, while a bull pennant pinches in between two converging trendlines toward an apex. The grading is the same family, so there is no reversal call and no catching a bottom, just a read on whether the continuation structure is clean.
Can it tell a clean pennant from one that drifted too wide or too deep?
It flags the risk in the bear case. If the consolidation never converged, drifted wide, or retraced most of the flagpole before the breakout, the grade drops and the trade plan calls out that the continuation thesis is weaker. A tight, symmetrical pennant that held its structure on lighter volume grades better.
What should be on the chart before I screenshot it?
Make sure the flagpole and the converging pennant are both visible, with the candles, timeframe, price scale, and volume showing. The 9 EMA and 20 EMA help, since the grade factors their position. The more of the pennant and breakout context that is visible in the image, the more complete the read.
What timeframes work best for a bull pennant?
Bull pennants show up on everything from 1-minute scalps to daily swings. Upload the timeframe you would actually trade from, with the flagpole, the converging consolidation, and volume visible, so the AI has the context that matters for the setup. There is no clock pressure on the grade, so you can take the read on any timeframe you trade.
Is there a free trial for bull pennant grading?
Yes. New users get two lifetime chart analyses. The first shows the full output so you can see exactly what the pennant grade returns; the second is gated to show what the paid product adds. No credit card required.
Grade the pennant before you chase the break.
Mark the pennant, screenshot the chart, and upload it from the homepage for a structured read on the setup.
Grade a Bull Pennant Free