Grade the fair value gap before you trade the fill.
Upload a chart where price left a bullish fair value gap and has pulled back into it, and get a read on the three-candle imbalance, whether a break of structure or displacement backs it, the reaction at the zone or the 50% midpoint, the uptrend context, and a full trade plan, so a gap with real structural confirmation and a standalone gap with no other confluence do not get judged the same way.
Drag and drop your chart screenshot
or click to browse. PNG, JPG, or WebP.
Your first analysis is free. No credit card.
Make sure both the time axis (X) and price axis (Y) are visible in your screenshot for accurate results.
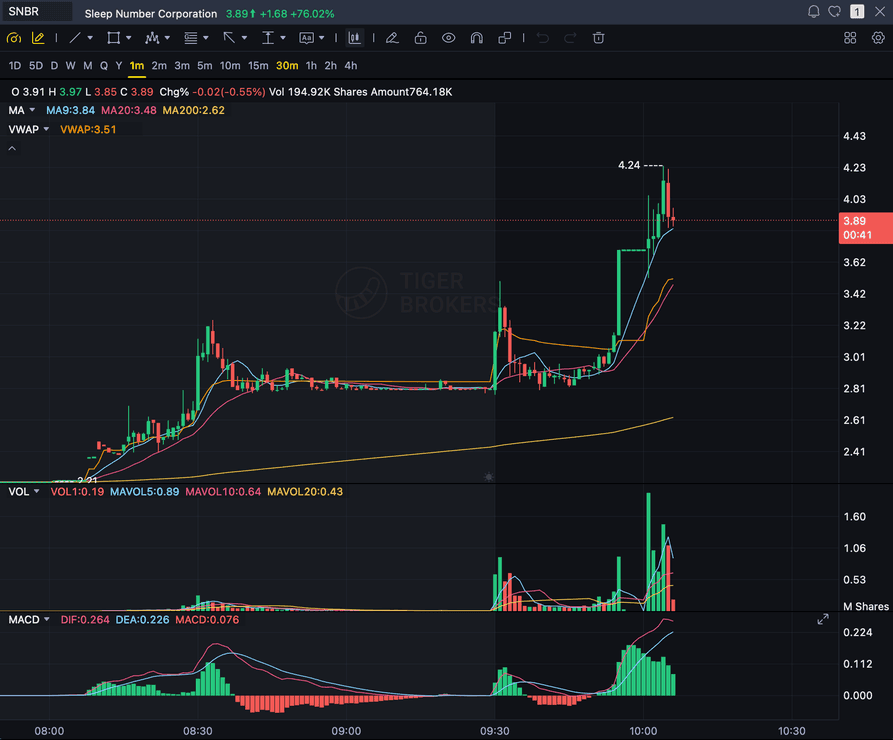
Grade
B+
Entry
$3.87
Stop
$3.75
Target
$4.24
Format example (stock chart)
SNBR 1m bull flag pullback: strong opening momentum, lighter-volume consolidation, and a late breakout attempt near 3.89. Forex, crypto and futures screenshots get the same structure: a grade, entry, structural stop and targets.
FVG
The three-candle gap between candle 1's high and candle 3's low, as marked
DISPLACEMENT
The impulsive candle 2 that left the gap behind
CE 50%
The midpoint of the gap, the level price often only needs to reach
BOS
A break of structure or displacement that strengthens the setup
Quick answer
What is a fair value gap, and can AI grade it?
A fair value gap (FVG) is a Smart Money Concepts (SMC/ICT) idea popularized by ICT (Michael J. Huddleston): a three-candle price imbalance. Candle 1 is the pre-move candle, candle 2 is a strong impulsive displacement candle, and candle 3 follows it.
For a bullish FVG, the gap is the zone between candle 1's high and candle 3's low, a price range candle 2 moved through so fast that no normal two-way trading occurred there. The premise is that the gap reflects one-sided order flow, buyers overwhelmed sellers so fast that the zone was never fairly traded both ways, so price is expected to often return and partially or fully fill, or rebalance, that gap before continuing in the original direction. Some vendors use the broader term "imbalance" for the same idea. SnapPChart grades that exact setup from the chart you upload: it reads the three-candle gap you marked, whether a break of structure or displacement move backs the setup (a standalone fair value gap with no other confluence is a weaker setup even by ICT's own teaching), the reaction as price pulls back into the zone or its 50% midpoint (called Consequent Encroachment in ICT terminology, since a gap commonly only needs a partial fill before continuing), and the uptrend the setup sits inside, then returns a setup grade, an entry off the pullback, a structural stop below the gap zone or the recent swing low, multi-target exits, and the bear case. It grades only the bullish fair value gap used as a long continuation entry within an existing uptrend, never the bearish fair value gap or a short. It reads the gap exactly as marked on your screenshot, not a live feed, and it does not scan a chart for fair value gaps, auto-identify the three-candle gap for you, watch the tape, or predict the next candle. You mark the FVG zone and the surrounding context, screenshot the chart, and upload it, and the same checklist runs every time so a gap backed by a real break of structure and a standalone gap with no other confluence get judged the same way.
What the AI Returns From a Screenshot
Use the output as a repeatable pre-trade checkpoint, not a prediction.
A-F Setup Grade
See whether the setup has enough pattern clarity, momentum, volume, and reward to justify the risk.
Entry, Stop, Targets
Get a structured trade plan with entry zone, invalidation level, targets, and risk/reward.
Screenshot-Based Read
Use charts from TradingView, Webull, ThinkOrSwim, MetaTrader, Robinhood, or any broker.
Risk Notes First
The analysis flags extension, messy chop, weak retests, thin reward, and conflicting indicators.
Workflow
Use it as a quality check on the gap
Plenty of fair value gaps get traded with nothing else behind them, no break of structure, no displacement, just a gap on the chart. SnapPChart gives you a consistent read on whether this gap has real structural backing before you trade the fill.
- Mark the three-candle gap, candle 1's high to candle 3's low, then screenshot the chart as price pulls back into it
- Check whether the gap sits inside an existing uptrend, a long continuation, not a fresh reversal call
- Note whether a break of structure or displacement move backs the gap, since a standalone gap is a weaker setup
- Read whether price is reacting off the zone or the 50% Consequent Encroachment midpoint, or punching straight through it
- Re-grade if price fully trades through the gap without a reaction to see if the thesis is failing
- Skip the trade when the grade flags a standalone gap with no structural confirmation or a zone that already traded through
Head to head
SnapPChart vs a general AI chat assistant for fair value gap setups
A general AI tool can tell you a chart has a gap, but it will not consistently check whether the three-candle imbalance is genuine, whether a break of structure or displacement move backs it, or whether the zone has already traded through, to the same standard twice. SnapPChart reads the gap you marked, the structural confirmation behind it, and the reaction at the zone the same way on every screenshot you upload, and it grades only the bullish, long-continuation setup.
| Feature | SnapPChart | General AI chat assistant |
|---|---|---|
| Grades the fair value gap you marked on the screenshot | Yes, every upload | Inconsistent |
| Reads whether a break of structure or displacement backs the gap | From the image | Varies by prompt |
| Judges the reaction at the zone or the 50% midpoint | Every grade | Rarely |
| Confirms the gap sits inside an existing uptrend, a continuation, not a fresh call | Every grade | Rarely |
| Flags a weak setup: no structural confirmation, a filled gap, a weak reaction | Every bear case | Rarely flagged |
| Entry, stop, targets off the fair value gap pullback | Yes | Prompting required |
| Same criteria on every fair value gap | Fixed methodology | Varies by session |
Learn the fair value gap setup
Use these guides to understand what makes a fair value gap grade well, so you take the read instead of the output blindly.
What do traders ask about Fair Value Gap AI?
How SnapPChart grades a bullish fair value gap retest from your screenshot.
How does the AI grade a fair value gap setup?
It reads the three-candle gap you marked, the zone between candle 1's high and candle 3's low, and whether a break of structure or displacement move backs the setup. It factors in the reaction as price pulls back into the zone or its 50% midpoint, and whether the setup sits inside an existing uptrend, then returns a setup grade, an entry off the pullback, a structural stop below the gap zone or the recent swing low, and targets. A gap backed by a clean break of structure, with a sharp reaction at the zone, grades higher than a standalone gap with no structural confirmation or one that has already been fully traded through.
Does SnapPChart grade the bearish fair value gap or short setups?
No. A fair value gap is not inherently bullish. A bearish FVG, the mirror three-candle gap during a down-move, is equally standard in the methodology, used as a short entry on a pullback into that zone. SnapPChart's engine grades long, trend-continuation setups only, so this page grades only the bullish fair value gap used as a long entry within an existing uptrend. The bearish fair value gap, the short mirror of this setup, is out of scope for this page.
How is a fair value gap different from an order block?
They both come from Smart Money Concepts, but they are defined by different structures. An order block is a single candle: the last opposing candle before an impulsive move that breaks structure, in the bullish case the last down-close candle before the rally. A fair value gap is a three-candle price imbalance: the gap between candle 1's high and candle 3's low that candle 2 ran through so fast no two-way trading happened there. An order block marks where the orders are believed to sit; a fair value gap marks a price range the market skipped over entirely. The two often overlap on the same chart, an order block retest and a fair value gap fill can sit right next to each other, but they are graded as distinct structures here. Use the order block page for the single-candle setup; use this page for the three-candle gap.
Does SnapPChart auto-detect or scan for fair value gaps, or read live price?
No. It does not scan a feed or a symbol list for fair value gaps, auto-identify the three-candle gap for you, watch the tape, or predict the next candle. You identify and mark the gap zone and the surrounding context, then screenshot and upload that chart, and the AI grades the structure it can see in the image: the gap, the candles around it, the trend, and the reaction at the zone. The grade reflects the picture you give it.
Does the gap need to be confirmed by a break of structure to grade well?
Not strictly, a fair value gap is commonly traded as a standalone point of interest. But it is considered a stronger, higher-conviction setup when it is paired with a break of structure or a displacement move, and a standalone gap with no other confluence is a weaker setup even by ICT's own teaching. Mark whether a break of structure backed the move that created the gap, since the grade weighs that context rather than treating every gap the same.
Does the gap need to fully fill before price continues?
Not usually. A fair value gap typically only needs a partial fill, commonly to the 50% midpoint of the gap, referred to as Consequent Encroachment in ICT terminology, before price can resume the original move. A full fill can happen, but treating a partial reaction at that midpoint as the expected outcome, rather than requiring the whole gap to close, is closer to how the concept is taught.
What should be on the chart before I screenshot it?
Mark the three candles that make up the gap, candle 1's high and candle 3's low, so the zone is visible, along with the candles, timeframe, and price scale, inside the uptrend the setup sits within. Any break of structure or displacement move behind the gap, and the pullback candle reacting at the zone, should be visible so the AI can judge how much confirmation the setup has. The more of that context is in frame, the more complete the read.
Is there a free trial for fair value gap grading?
Yes. New users get two lifetime chart analyses. The first shows the full output so you can see exactly what the fair value gap grade returns; the second is gated to show what the paid product adds. No credit card required.
Grade the fair value gap before you trade the fill.
Mark the three-candle gap and the surrounding structure, screenshot the chart, and upload it from the homepage for a structured read on the setup.
Grade a Fair Value Gap Setup Free