Grade the three inside down before you trade the continuation.
Upload a chart with a three inside down harami pause inside a downtrend and get a read on the contained middle candle, the breakdown below the first candle's low, the trend leading in, the EMA position, the volume behind the confirmation, and a full trade plan, so a tight harami pause that resumes the downtrend and a stretched one that stalls do not get graded the same way.
Drag and drop your chart screenshot
or click to browse. PNG, JPG, or WebP.
Your first analysis is free. No credit card.
Make sure both the time axis (X) and price axis (Y) are visible in your screenshot for accurate results.
Grade
B+
Entry
$3.87
Stop
$3.75
Target
$4.24
Sample readout
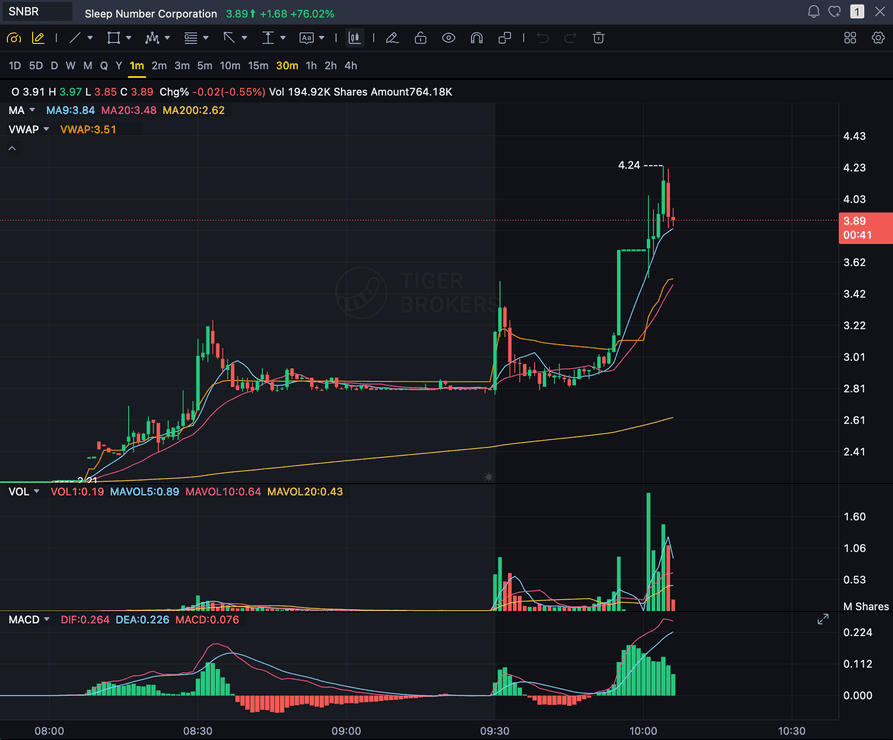
SNBR 1m bull flag pullback: strong opening momentum, lighter-volume consolidation, and a late breakout attempt with the 3.89 price marker near the current candle.
HARAMI
The small second candle contained inside the first candle's range
BREAKDOWN
The third candle closing below the first candle's low
DOWNTREND
The prior trend the harami pause sits inside
VOLUME
Whether the confirmation candle came on real participation
Quick answer
What is three inside down, and can AI grade it?
Three inside down is a three-candle bearish pattern built on a harami: candle one has a larger body, candle two is a small-bodied candle that sits fully inside candle one's high-low range, and candle three is a strong bearish candle that closes below candle one's low, confirming the move.
It is one of the most heavily documented candlestick patterns, covered across Bulkowski's pattern statistics site and most technical-analysis education sites, and it shows up often on real charts. SnapPChart grades the WITH-TREND, continuation version of it: a harami pause that forms inside an existing downtrend, then candle three breaks below candle one's low to confirm the downtrend is resuming. That is the read the engine takes, a brief pause and resume, not the textbook top-reversal version where the harami appears after an uptrend and marks a reversal to the downside, because that is a counter-trend reversal and the grader does not trade those. From the chart you upload it reads candle one's range, whether candle two is genuinely contained inside that range, whether candle three closes below candle one's low, the prior downtrend context, the 9 and 20 EMA position, and the volume behind the confirmation candle, then returns a setup grade, a short entry on the with-trend continuation, a structural stop above the harami, multi-target exits, and the bear case. It reads the image you upload, not a live feed, and it does not auto-detect or scan for the pattern, draw the candles for you, watch the tape, or predict the next candle. You mark the three candles, screenshot the chart, and upload it, and the same checklist runs every time so a tight harami pause that resumes a real downtrend and a loose one that really formed after an uptrend get judged differently.
What the AI Returns From a Screenshot
Use the output as a repeatable pre-trade checkpoint, not a prediction.
A-F Setup Grade
See whether the setup has enough pattern clarity, momentum, volume, and reward to justify the risk.
Entry, Stop, Targets
Get a structured trade plan with entry zone, invalidation level, targets, and risk/reward.
Screenshot-Based Read
Use charts from TradingView, Webull, ThinkOrSwim, MetaTrader, Robinhood, or any broker.
Risk Notes First
The analysis flags extension, messy chop, weak retests, thin reward, and conflicting indicators.
Workflow
Use it as a quality check on the three inside down
Plenty of three inside down patterns fail when the harami really marks a top in an uptrend, candle two is not fully contained, or the confirmation candle comes on thin volume. SnapPChart gives you a consistent read on whether the pause is extending a real downtrend before you trade the breakdown.
- Mark the three candles and screenshot the chart with the prior trend visible
- Check candle two sits fully inside candle one's high-low range, the harami containment
- Confirm candle three closes below candle one's low, the confirmation break
- Check the pattern is forming inside an existing downtrend, not after an uptrend
- Read the 9 EMA and 20 EMA trend context the pattern sits inside
- Re-grade after the move to see if it held, and skip the trade when the grade flags a loose containment, thin confirmation volume, or no clear prior downtrend
Head to head
SnapPChart vs a general AI chat assistant for three inside down setups
A general AI tool can spot three candles that look like a harami, but it will not judge whether candle two is genuinely contained inside candle one's range, whether the pattern sits inside a downtrend rather than at the top of an uptrend, or whether candle three actually confirmed below candle one's low, to the same standard twice. SnapPChart reads the containment, the confirmation break, the prior trend, and the volume the same way on every screenshot you upload.
| Feature | SnapPChart | General AI chat assistant |
|---|---|---|
| Grades the three inside down you marked on the screenshot | Yes, every upload | Inconsistent |
| Reads whether candle two is fully contained inside candle one's range | From the image | Varies by prompt |
| Checks candle three closes below candle one's low to confirm | Every grade | Rarely |
| Confirms the harami pause sits inside a downtrend, not an uptrend top | Every grade | Rarely |
| Flags a weak setup: loose containment, weak confirmation candle, thin volume | Every bear case | Rarely flagged |
| Entry, stop, targets off the with-trend continuation | Yes | Prompting required |
Learn the three inside down setup
Use these guides to understand what makes a three inside down grade well, so you take the read instead of the output blindly.
What do traders ask about Three Inside Down AI?
How SnapPChart grades a three inside down from your screenshot.
How does the AI grade a three inside down?
It reads candle one's high-low range, whether candle two sits fully inside that range, and whether candle three closes below candle one's low to confirm the move. It factors the prior downtrend, the 9 and 20 EMA position, and the volume behind the confirmation candle into the grade, then returns a setup grade, a short entry on the with-trend continuation, a structural stop above the harami, and targets. A tight harami with a decisive break below candle one's low inside a clear downtrend on rising volume grades higher than a loose containment with a weak confirmation candle or no real prior trend.
Does it grade the top-reversal version of three inside down?
No. The classic textbook use of three inside down is a top reversal, the harami forming after an uptrend and marking a reversal to the downside, but that is a counter-trend reversal and SnapPChart's engine does not trade reversals. It grades the with-trend, continuation version: a harami pause forming inside an existing downtrend, confirmed by candle three breaking below candle one's low. If you mark a three inside down that is really forming at the top of an uptrend, the grade and the bear case flag that it is counter-trend, not the continuation the grader is built for.
How is three inside down different from three black crows?
Both are bearish, with-trend continuation patterns SnapPChart grades, but the structure is different. Three inside down is a harami-plus-confirmation pattern: a larger candle, a small candle contained fully inside its range, then a breakdown candle below the first candle's low, a pause and a resume in three candles. Three black crows is three consecutive full-bodied red candles marching lower with no containment at all, a steady uninterrupted decline rather than a pause. SnapPChart reads the containment and the breakdown level for a three inside down, and the candle-by-candle decline and wick size for three black crows.
Does SnapPChart auto-detect or scan for three inside down, or read live price?
No. It does not scan a feed for the pattern, draw the candles for you, watch the tape, or predict the next candle. You identify and mark the three candles, then screenshot and upload that chart, and the AI grades the structure it can see in the image: candle one's range, the containment of candle two, the break below candle one's low, the prior trend, the EMAs, and the volume. The grade reflects the picture you give it.
Can it tell a strong three inside down from a weak one?
It flags the weak-structure risk in the bear case. If candle two is not fully contained inside candle one's range, candle three barely closes below candle one's low on thin volume, the pattern is far extended from the moving averages, or there is no clear prior downtrend, the grade drops and the trade plan calls out that the continuation thesis is weaker. A clean containment with a decisive confirmation candle on rising volume inside a real downtrend grades better.
Is there a free trial for three inside down grading?
Yes. New users get two lifetime chart analyses. The first shows the full output so you can see exactly what the three inside down grade returns; the second is gated to show what the paid product adds. No credit card required.
Grade the three inside down before you trade the continuation.
Mark the three candles, screenshot the chart, and upload it from the homepage for a structured read on the with-trend continuation setup.
Grade a Three Inside Down Free