Screenshot your Fidelity Active Trader Pro chart, get a graded trade plan back.
SnapPChart reads a Fidelity Active Trader Pro chart screenshot the way you do, the candles, the levels, and whatever of the 129 configurable indicators you have on the chart, then returns a setup grade, entry, stop, targets, and the main reason it could fail. No account link, no API, no plugin. It reads the picture you upload, so the same grade works whether you trade stocks, options, or futures on Active Trader Pro.
Drag and drop your chart screenshot
or click to browse. PNG, JPG, or WebP.
Your first analysis is free. No credit card.
Make sure both the time axis (X) and price axis (Y) are visible in your screenshot for accurate results.
Grade
B+
Entry
$3.87
Stop
$3.75
Target
$4.24
Format example (stock chart)
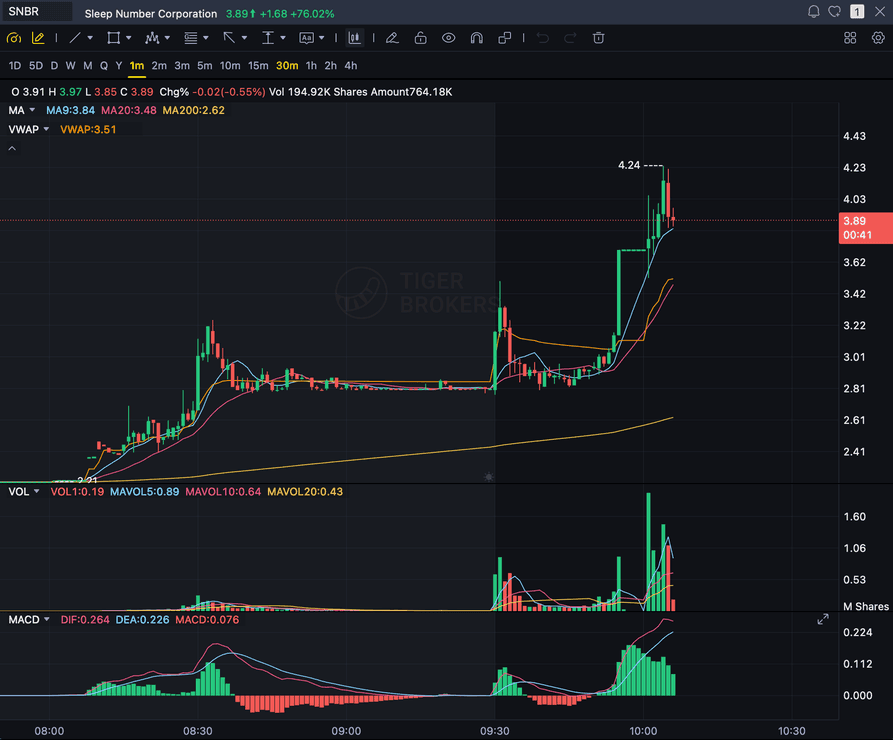
SNBR 1m bull flag pullback: strong opening momentum, lighter-volume consolidation, and a late breakout attempt near 3.89. Forex, crypto and futures screenshots get the same structure: a grade, entry, structural stop and targets.
STOCKS
Momentum, breakout, pullback, and reversal setups
FOREX
Major pairs, crosses, XAUUSD, and session context
CRYPTO
Bitcoin, Ethereum, and high-beta altcoin charts
FUTURES
Index, commodity, and intraday futures screenshots
Quick answer
How do you analyze a Fidelity Active Trader Pro chart with AI?
You screenshot the chart in Active Trader Pro and upload the image. SnapPChart reads the screenshot directly, the candles, trend, support and resistance, volume, and any of the 129 configurable indicators you have on the chart, then grades the setup A+ to F with an entry, a structural stop, multi-target exits, and a bear case. Fidelity is one of the largest US brokers, with roughly 50 million individual customer accounts, and Active Trader Pro (ATP) is its real, proprietary desktop platform built for the active-trading slice of that base rather than the retirement and long-term-investing relationships most of those accounts represent, so this is the fastest honest answer to which AI can read a Fidelity screenshot: you do not link your brokerage account, you do not connect an API, there is no plugin, and it does not route or place orders, read your live positions, balances, or order status, auto-manage a trade, or read Fidelity's own in-platform indicator or alert feed, because the analyzer reads the picture, not your platform or a data feed. That also means it is platform-agnostic. The same upload works whether you chart in Active Trader Pro, thinkorswim, tastytrade, or TradingView, and the same grading checklist runs on every screenshot so a strong setup and a weak one get judged the same way.
What the AI Returns From a Screenshot
Use the output as a repeatable pre-trade checkpoint, not a prediction.
A-F Setup Grade
See whether the setup has enough pattern clarity, momentum, volume, and reward to justify the risk.
Entry, Stop, Targets
Get a structured trade plan with entry zone, invalidation level, targets, and risk/reward.
Screenshot-Based Read
Use charts from TradingView, Webull, ThinkOrSwim, MetaTrader, Robinhood, or any broker.
Risk Notes First
The analysis flags extension, messy chop, weak retests, thin reward, and conflicting indicators.
Workflow
How do you turn a Fidelity screenshot into a graded setup?
You do not connect your account or rebuild the chart. Screenshot it in Active Trader Pro, drop the image in, and read the grade.
- Screenshot any symbol on any timeframe in Active Trader Pro (desktop, web, or mobile)
- Upload the image, with no account link, no API, and no plugin
- The analyzer reads candles, levels, volume, and the indicators visible on your chart
- Read the A+ to F grade, entry, stop, targets, and the bear case
- Pass on the C and F setups, then screenshot the next chart
Head to head
SnapPChart vs a general AI chat assistant for a Fidelity Active Trader Pro screenshot
Active Trader Pro traders land here after pasting a stock, options, or futures chart into a general AI tool and getting a vague paragraph back. Here is how a purpose-built screenshot grader compares for the last read before you place the order.
| Feature | SnapPChart | General AI chat assistant |
|---|---|---|
| Reads your Active Trader Pro chart screenshot | Every upload | Inconsistent |
| Setup grade (A+ to F) on a stock or options chart | Yes | No |
| Entry, structural stop, and targets | Every upload | Varies by prompt |
| Reads the indicators visible on your 129-indicator chart | From the image | Varies by prompt |
| Bear case / invalidation called out | Every grade | Rarely flagged |
| Same criteria on every Fidelity chart | Fixed methodology | Varies by session |
Keep Learning the Setup
Use these guides to understand how SnapPChart grades the trade instead of taking the output blindly.
What do traders ask about Fidelity Chart Analysis?
How the AI reads a Fidelity Active Trader Pro screenshot and what it returns.
How do I analyze a Fidelity chart with AI?
Screenshot the chart in Active Trader Pro, then upload the image to SnapPChart. A multimodal vision model reads the candles, trend, support and resistance, volume, and any visible indicators directly from the picture, then returns a setup grade, an entry, a structural stop, targets, and the main reason the trade could fail. You do not type out what the chart shows or connect your Fidelity account.
Is SnapPChart a Fidelity plugin or account integration?
No. There is nothing to install, no API to connect, and no brokerage account to link. SnapPChart is not affiliated with, endorsed by, or built by Fidelity. It does not read your live Fidelity positions, balances, or order status, does not auto-place or auto-manage a trade, and does not read Active Trader Pro's own indicator or alert feed. It reads the screenshot you upload, so it works alongside Fidelity without being part of it. That is on purpose: reading the image instead of your account or a data feed is what lets the same tool grade a chart from Active Trader Pro, thinkorswim, tastytrade, or any other platform.
Does Fidelity or Active Trader Pro have its own AI chart analysis?
No AI-branded chart-analysis feature is documented anywhere in Active Trader Pro's platform description. If Fidelity offers any pattern-recognition tool elsewhere in its lineup, it would fall in the same non-AI, rules-based scanner category (the kind some brokers license from a vendor like Recognia) already true of thinkorswim and Power E*TRADE, not a native, model-driven feature. SnapPChart is a separate, unaffiliated tool that reads the screenshot you upload.
What instruments can I analyze from a Fidelity chart?
Active Trader Pro covers stocks, ETFs, options, and fixed income, so the underlying price charts you screenshot for those are in scope as long as the candles, timeframe, and price scale are visible. The grader reads the price chart, not an options chain, so screenshot the underlying chart you are basing the trade on.
Does it read the 129 indicators on my Active Trader Pro chart?
It reads whichever indicators are visible in the screenshot. Active Trader Pro ships 129 configurable technical indicators, more than most broker platforms, and if you have moving averages, VWAP, MACD, RSI, or volume showing on the chart, the analyzer factors what it can see into the grade. It cannot read an indicator you have hidden or a setting that is not shown, because it only has the picture. Show the studies you care about before you screenshot.
Is Fidelity chart analysis free to try?
Yes. New users get two lifetime chart analyses, no credit card required. The first analysis shows the full depth so you can see exactly what the AI returns from a Fidelity screenshot; the second is gated to show what the paid product adds.
Does it place trades or predict where price goes next?
No. It is a pre-trade decision layer, not an autonomous trader and not a price predictor. It grades the setup in the screenshot so your process stays repeatable. It does not connect to Fidelity, does not route or place orders, does not read your live positions, balances, or order status, does not auto-manage a trade, and does not call the next candle. You stay the decision-maker.
Grade your next Fidelity chart.
Screenshot a chart in Active Trader Pro, upload it from the homepage, and get a graded trade plan in seconds. No account link and no credit card required.
Analyze a Fidelity Chart Free