Grade the 50-day MA pullback before you buy the swing dip.
Upload a daily chart with the 50-day SMA plotted and price pulling back to it, and get a read on whether the average is still rising, whether the pullback candle shows a genuine reversal on rising volume, the uptrend leading in, and a full trade plan, so a real buy-the-dip setup and a pullback that is quietly breaking down do not get the same benefit of the doubt.
Drag and drop your chart screenshot
or click to browse. PNG, JPG, or WebP.
Your first analysis is free. No credit card.
Make sure both the time axis (X) and price axis (Y) are visible in your screenshot for accurate results.
Grade
B+
Entry
$3.87
Stop
$3.75
Target
$4.24
Format example (stock chart)
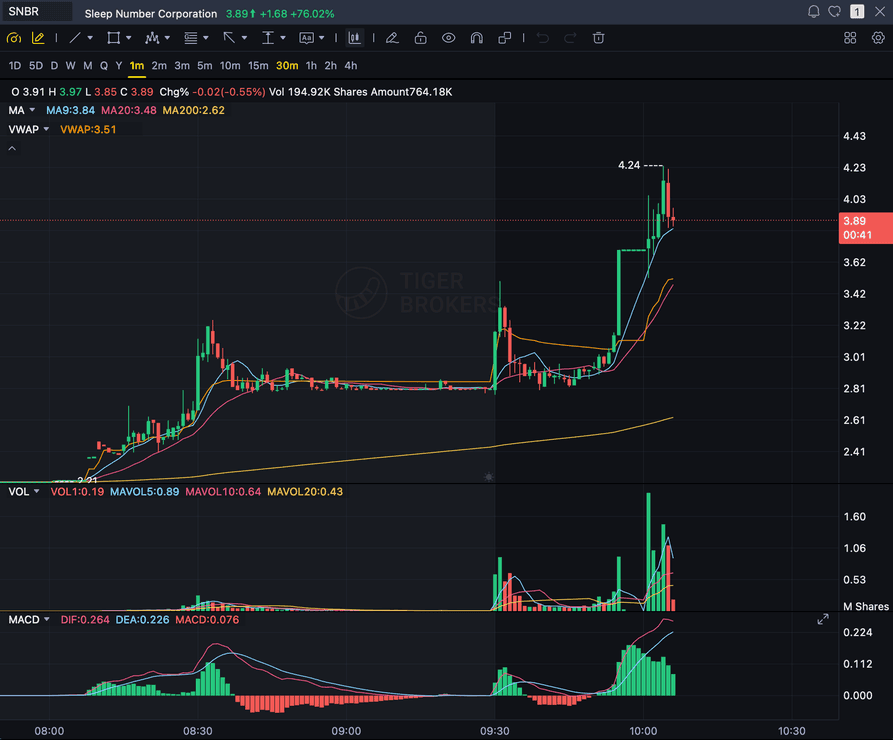
SNBR 1m bull flag pullback: strong opening momentum, lighter-volume consolidation, and a late breakout attempt near 3.89. Forex, crypto and futures screenshots get the same structure: a grade, entry, structural stop and targets.
50 SMA
The rising simple moving average price is pulling back to
REVERSAL CANDLE
Confirms the bounce instead of a stall through the average
VOLUME
Whether the reversal candle came on rising volume
DAILY CHART
A swing setup on the slower 50-day SMA, not the faster EMA pullback
Quick answer
What is a 50-day MA pullback, and can AI grade it?
A 50-day moving average pullback is a swing-trading continuation setup: in an established uptrend, price pulls back to the rising 50-day SMA, prints a reversal candle on rising volume, then resumes higher. It is a classic buy-the-dip entry on the daily chart, using a slower moving average and a longer typical hold than the faster 9/20 EMA pullback.
The 50-day SMA pullback is one of the more durable swing-trading entries because a rising 50-day average acts as dynamic support in a trending stock: price stretches away from it during the up-leg, drifts back down to reach it, and buyers who use the average as a reference step back in. It is documented in swing-trading literature, including T. Livingston's Swing Into It and dedicated guides from sites like TradingSim, as a classic buy-the-dip continuation, not a reversal call. This page grades that setup specifically against the 50-day SMA on a daily chart. It reads the chart you upload: the 50-day SMA line plotted on price, whether it is genuinely rising, the pullback candle and whether it shows a real reversal, a hammer, an engulfing candle, or a strong close off the low, instead of just touching the line and continuing down, the volume on that reversal candle, and the broader uptrend structure leading into the pullback, then returns a setup grade, an entry, a structural stop below the SMA, multi-target exits, and the bear case. It reads the SMA line drawn on your screenshot, not a live 50-day SMA calculation, and it needs that line visible to grade the setup at all. This is a distinct setup from the site's EMA pullback page: EMA pullback grades the pullback against the faster 9 and 20 EMA, typically used on a shorter timeframe and held for a shorter stretch, while this page grades a daily-chart swing setup against the slower 50-day SMA, typically held over days to weeks. Same underlying idea, a pullback in an uptrend that resumes, graded against a different indicator and a different typical holding period, so use whichever page matches the chart and hold time you are actually trading. It does not scan a feed for 50-day SMA pullbacks, does not calculate the SMA itself, does not auto-detect the reversal candle for you, and does not predict the next candle. You plot the 50-day SMA, confirm it is rising, mark the pullback and its reversal candle, screenshot the chart, and upload it, and the same checklist runs every time so a genuine reversal on rising volume and a pullback that just grazes the average and keeps falling get judged the same way.
What the AI Returns From a Screenshot
Use the output as a repeatable pre-trade checkpoint, not a prediction.
A-F Setup Grade
See whether the setup has enough pattern clarity, momentum, volume, and reward to justify the risk.
Entry, Stop, Targets
Get a structured trade plan with entry zone, invalidation level, targets, and risk/reward.
Screenshot-Based Read
Use charts from TradingView, Webull, ThinkOrSwim, MetaTrader, Robinhood, or any broker.
Risk Notes First
The analysis flags extension, messy chop, weak retests, thin reward, and conflicting indicators.
Workflow
Use it as a quality check on the 50-day pullback
Plenty of 50-day SMA pullbacks fail when the average is flattening out or the reversal candle shows up on light volume. SnapPChart gives you a consistent read on whether this pullback is a genuine buy-the-dip setup before you take it.
- Plot the 50-day SMA on the daily chart and screenshot the pullback as price reaches it
- Confirm the 50-day SMA is genuinely rising, not flattening or rolling over
- Check that the pullback prints a real reversal candle, not just a touch of the average
- Read whether the reversal candle came on rising volume or thin, unconvincing volume
- Confirm the broader uptrend leading into the pullback is still intact
- Skip the trade when the grade flags a flattening average, a weak reversal candle, or light volume
Head to head
SnapPChart vs a general AI chat assistant for 50-day MA pullback setups
A general AI tool can tell you price pulled back to a moving average, but it will not reliably check that the 50-day SMA is actually rising, that the pullback candle is a genuine reversal instead of a stall, or that the reversal came on rising volume, to the same standard twice. SnapPChart reads the 50-day SMA you plotted, the reversal candle, the established uptrend, and the volume the same way on every screenshot you upload.
| Feature | SnapPChart | General AI chat assistant |
|---|---|---|
| Grades the 50-day MA pullback you marked on the screenshot | Yes, every upload | Inconsistent |
| Reads the 50-day SMA plotted on the daily chart | From the image | Varies by prompt |
| Confirms the 50-day SMA is genuinely rising, not flattening | Every grade | Rarely |
| Checks the pullback for a real reversal candle on rising volume | Every grade | Rarely |
| Distinguishes this 50-day SMA swing setup from the faster EMA pullback | Every grade | Rarely |
| Entry, stop, targets off the reversal candle | Yes | Prompting required |
| Same criteria on every 50-day MA pullback | Fixed methodology | Varies by session |
Learn the 50-day MA pullback setup
Use these guides to understand what makes a 50-day SMA pullback grade well, so you take the read instead of the output blindly.
What do traders ask about 50-Day MA Pullback AI?
How SnapPChart grades a 50-day MA pullback from your screenshot.
How does the AI grade a 50-day MA pullback?
It reads the 50-day SMA plotted on your daily chart, checks that the average is genuinely rising rather than flattening out, and reads the pullback candle for a real reversal, a hammer, an engulfing candle, or a strong close off the low, instead of a stall that just touches the line and keeps falling. It factors in the volume on that reversal candle and the broader uptrend structure leading into the pullback, then returns a setup grade, an entry, a structural stop below the 50-day SMA, and targets. A pullback that prints a clean reversal candle on rising volume against a genuinely rising average grades higher than a pullback where the average has flattened or the reversal candle is thin and unconvincing.
How is a 50-day MA pullback different from an EMA pullback?
They are graded against different moving averages and different typical holding periods, even though both are trend-continuation buys off a moving average. The EMA pullback page grades price bouncing off the faster 9 or 20 EMA, typically used on a shorter timeframe and held for a shorter stretch. This page grades a daily-chart swing setup: price pulling back to the slower 50-day SMA on the daily timeframe, held over days to weeks rather than a single session, built for swing traders. The underlying idea is the same, a pullback in an uptrend that resumes, but the indicator period and the typical holding period are different, so grade the setup against the page that matches the chart and hold time you are actually trading.
Does SnapPChart calculate the 50-day SMA itself, or read it from the screenshot?
It reads the 50-day SMA line exactly as it is drawn on the daily chart you upload, not a live calculation and not a price feed. Plot the 50-day simple moving average on your charting platform, confirm it is visible and genuinely trending up, then screenshot and upload the chart with the pullback showing. If the 50-day SMA is not on the chart, the grade has nothing to check the pullback against.
What should be on the chart before I screenshot it?
Make sure the 50-day SMA is plotted on the daily chart, with the candles, timeframe, price scale, and volume all visible. The uptrend leading into the pullback should be visible too, since the grade checks whether the average is genuinely rising and whether the broader structure above it is intact. The more of the trend and the reversal candle that show clearly in the image, the more complete the read.
Can it tell a genuine reversal from a pullback that is quietly breaking down?
It flags the breakdown risk in the bear case. If the 50-day SMA is flattening instead of rising, the reversal candle is thin or unconvincing, or price slices through the average on heavy volume instead of holding and reversing, the grade drops and the trade plan calls out that the continuation thesis is weaker. A reversal candle that closes strongly off the low on rising volume, against a clearly rising average, grades better.
Does SnapPChart scan for 50-day MA pullbacks, or read live price?
No. It does not scan a watchlist or a live feed for 50-day SMA pullbacks, does not calculate the average itself, does not auto-detect the reversal candle for you, and does not predict the next candle. You plot the 50-day SMA, confirm it is rising, mark the pullback and its reversal candle, screenshot the chart, and upload it, and the AI grades exactly what is in that image: the average, the reversal candle, the uptrend, and the volume. The grade reflects the picture you give it.
Is there a free trial for 50-day MA pullback grading?
Yes. New users get two lifetime chart analyses. The first shows the full output so you can see exactly what the 50-day MA pullback grade returns; the second is gated to show what the paid product adds. No credit card required.
Grade the pullback before you buy the swing dip.
Plot the 50-day SMA, mark the pullback and its reversal candle, screenshot the chart, and upload it from the homepage for a structured read on the setup.
Grade a 50-Day MA Pullback Free