Grade the double bottom after it confirms, before you trade the continuation.
Upload a chart where a double bottom has formed, the neckline has broken, and a new uptrend has started, and get a read on whether the breakout held, whether higher highs and higher lows are printing, the volume, and a full trade plan, so a confirmed continuation in the new uptrend and an unconfirmed bounce still basing at the low do not get judged the same way.
TWO LOWS
The double bottom, the two lows you marked on your chart
NECKLINE
The middle peak between the lows that confirms on a break
BREAKOUT
Whether the neckline broke and a new uptrend started
VOLUME
Whether the breakout came on conviction or thin volume
Grade
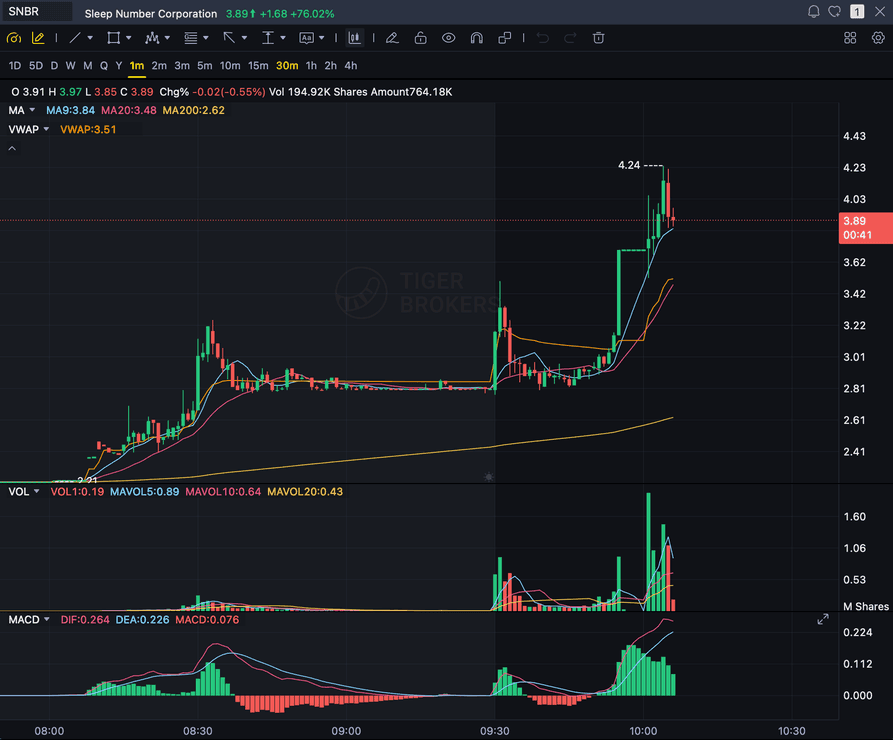
B+
Entry
$3.87
Stop
$3.75
Target
$4.24
Sample readout
SNBR 1m bull flag pullback: strong opening momentum, lighter-volume consolidation, and a late breakout attempt with the 3.89 price marker near the current candle.
Quick answer
What is a double bottom, and can AI grade it?
A double bottom is a bottoming reversal pattern: price falls to a low, bounces to an interim peak, falls back to roughly the same low a second time, then turns up again, forming a W. The middle peak between the two lows is the neckline, and the pattern is considered confirmed once price breaks above that neckline. SnapPChart is tuned for momentum continuations, not reversals, so it does not call the bottom or grade a long at the second low. A chart that is still basing at the low, with the neckline unbroken, is an unconfirmed bottom, and the engine treats it as a downtrend that is bouncing, not a long. What it grades is the confirmed continuation after the double bottom resolves: once the neckline breaks and an established uptrend prints, with higher highs and higher lows, the first pullback within that new uptrend is the momentum-continuation long it grades. From the chart you upload, it reads the two lows, the neckline, the breakout, whether a new uptrend has started, and the volume, then returns a setup grade, an entry on the pullback in the new uptrend, a structural stop, multi-target exits, and the bear case. It reads the pattern you marked on your screenshot, not a live feed, and it does not scan or auto-detect double bottoms, plot or draw the pattern for you, read live price, stream the tape, predict the breakout, or call the reversal at the low. You mark the pattern, screenshot the chart, and upload it, and the same checklist runs every time so a confirmed continuation in the new uptrend and a chart still basing at the low get judged the same way.
What the AI Returns From a Screenshot
Use the output as a repeatable pre-trade checkpoint, not a prediction.
A-F Setup Grade
See whether the setup has enough pattern clarity, momentum, volume, and reward to justify the risk.
Entry, Stop, Targets
Get a structured trade plan with entry zone, invalidation level, targets, and risk/reward.
Screenshot-Based Read
Use charts from TradingView, Webull, ThinkOrSwim, MetaTrader, Robinhood, or any broker.
Risk Notes First
The analysis flags extension, messy chop, weak retests, thin reward, and conflicting indicators.
Workflow
Use it as a quality check on the confirmed continuation
Plenty of double bottoms fail when the neckline never breaks, price is still basing at the low, or no new uptrend has started. SnapPChart gives you a consistent read on whether this double bottom has confirmed into a tradeable continuation before you take the pullback in the new uptrend.
- Mark the two lows and the neckline, and screenshot the chart with the pattern visible
- Confirm the neckline has broken, not a chart still basing at the second low
- Check whether a new uptrend has started, with higher highs and higher lows
- Read whether the breakout came on rising volume or thin volume
- Grade the first pullback within that new uptrend, not the unconfirmed bounce at the low
- Skip the trade when the grade flags an unconfirmed bottom with the neckline still intact
Head to head
SnapPChart vs a general AI chat assistant for double bottom setups
A general AI tool can tell you a chart looks like a double bottom, but it will not judge whether the neckline has broken, whether a new uptrend has actually started, or whether the bottom is confirmed enough to trade, to the same standard twice. SnapPChart reads the two lows, the neckline, the breakout, and whether higher highs and higher lows have printed the same way on every screenshot you upload, and it grades the continuation after the bottom confirms, not the bounce at the low.
| Feature | SnapPChart | General AI chat assistant |
|---|---|---|
| Grades the double bottom you marked on the screenshot | Yes, every upload | Inconsistent |
| Reads whether the neckline broke and a new uptrend started | From the image | Varies by prompt |
| Grades the first pullback in the new uptrend, not the unconfirmed low | Every grade | Rarely |
| Flags a weak setup: neckline not broken, still basing at the low, no higher highs yet | Every bear case | Rarely flagged |
| Entry, stop, targets off the confirmed continuation | Yes | Prompting required |
| Same criteria on every double bottom | Fixed methodology | Varies by session |
Learn the double bottom setup
Use these guides to understand what makes a double bottom grade well, so you take the read instead of the output blindly.
Double Bottom AI FAQ
How SnapPChart grades a double bottom from your screenshot.
Does the AI grade the entry at the second low?
No. It is tuned for momentum continuation, not reversals, so it does not call the bottom or grade a long at the second low. It grades the setup highest after the neckline breaks and a new uptrend is established, with higher highs and higher lows, then the first pullback in that new uptrend, not the unconfirmed bounce at the low. While price is still basing at the second low with the neckline unbroken, the engine reads a chart that is bouncing inside a downtrend, and that is not a long for it.
How does the AI grade a double bottom?
It reads the two lows, the neckline between them, the breakout, whether a new uptrend has started with higher highs and higher lows, and the volume. It grades the confirmed continuation, the first pullback in the new uptrend after the neckline breaks, then returns a setup grade, an entry on that pullback, a structural stop, and targets. A double bottom that has broken its neckline on rising volume with a clean new uptrend printing grades higher than a chart still basing at the low.
Does SnapPChart auto-detect or scan for double bottoms, or predict the breakout?
No. It does not scan a feed for double bottoms, plot or draw the pattern for you, watch the tape, predict the neckline breakout, or call the reversal at the low. You identify and mark the pattern, then screenshot and upload that chart, and the AI grades the structure it can see in the image: the two lows, the neckline, whether it broke, whether a new uptrend has started, and the volume. The grade reflects the picture you give it.
Can it tell a confirmed double bottom from an unconfirmed one?
It flags the risk in the bear case. If the chart shows price still basing at the second low, the neckline unbroken, no higher highs yet, or a breakout on thin volume, the grade drops and the trade plan calls out that the bottom is not confirmed into a continuation. A clean neckline break with a new uptrend printing and rising volume grades better.
What should be on the chart before I screenshot it?
Mark the two lows and the neckline so the pattern is visible, along with the candles, timeframe, price scale, and volume. The more of the breakout and the start of the new uptrend that is in frame, the more complete the read, since the grade is about whether the double bottom has confirmed into a continuation. If only the two lows are visible with no neckline break, the AI has nothing to grade as a continuation yet.
Is there a free trial for double bottom grading?
Yes. New users get two lifetime chart analyses. The first shows the full output so you can see exactly what the double bottom grade returns; the second is gated to show what the paid product adds. No credit card required.
Grade the double bottom after it confirms, before you trade the continuation.
Mark the two lows and the neckline, screenshot the chart with the breakout and the new uptrend visible, and upload it from the homepage for a structured read on the setup.
Grade a Double Bottom Free