Grade the golden pocket pullback before you buy the bounce.
Upload a chart with the Fibonacci retracement tool drawn over the most recent swing low to swing high, price pulling back into the 61.8%-65% golden pocket zone, and get a read on whether the broader uptrend is genuinely intact, the retracement actually reached the zone, the volume, and a full trade plan, so a real golden pocket bounce in a healthy uptrend and a shallow dip with no real trend context do not get the same benefit of the doubt.
Drag and drop your chart screenshot
or click to browse. PNG, JPG, or WebP.
Your first analysis is free. No credit card.
Make sure both the time axis (X) and price axis (Y) are visible in your screenshot for accurate results.
Grade
B+
Entry
$3.87
Stop
$3.75
Target
$4.24
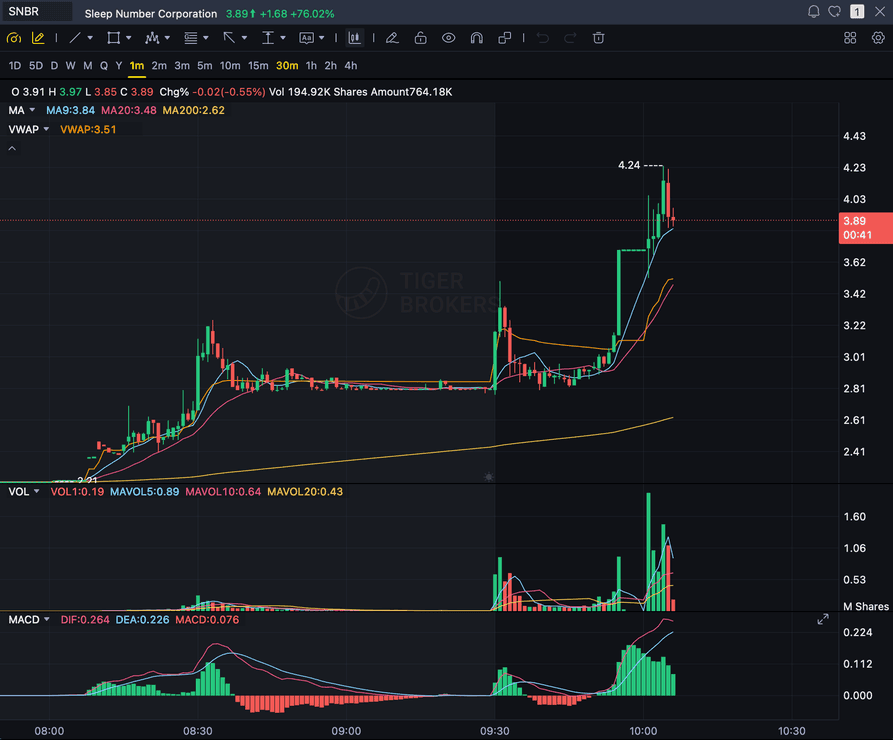
Format example (stock chart)
SNBR 1m bull flag pullback: strong opening momentum, lighter-volume consolidation, and a late breakout attempt near 3.89. Forex, crypto and futures screenshots get the same structure: a grade, entry, structural stop and targets.
61.8%-65%
The golden pocket retracement zone Carney popularized
SWING HIGH/LOW
The impulse leg you mark with the Fibonacci tool
UPTREND
The established trend that must be genuinely intact above the pullback
CONTINUATION
A pullback entry within the trend, not a reversal call
Quick answer
What is the golden pocket, and can AI grade it?
The golden pocket is the 61.8% to 65% Fibonacci retracement zone, a pullback-entry area popularized by harmonic trader Scott Carney. Traders draw a Fibonacci retracement over the most recent swing low to swing high in an uptrend, then watch for price to pull back into that narrow zone as a high-probability continuation entry, not a reversal signal.
Draw a Fibonacci retracement tool from the swing low to the swing high of the most recent impulse leg in an established uptrend, and the tool's built-in 61.8% and 65% levels mark the golden pocket, the narrow band between them. The name comes from that overlap: 0.618 is the golden ratio itself, and 0.65 approximates what Carney called the golden mean, the ratio's square root, so the zone where both levels sit close together is read as a higher-probability area for the pullback to hold than the wider 50%-61.8% band some traders default to. SnapPChart grades that pullback from the chart you upload: it reads the Fibonacci retracement zone exactly as you drew it, whether price is currently pulling back into the 61.8%-65% band, whether the broader trend above the pullback is a genuine, established uptrend rather than one already rolling over, the volume characteristics of the pullback, and any confirming candle or price action printing at the zone, then returns a setup grade, an entry on the bounce, a structural stop below the zone, multi-target exits, and the bear case. Because the setup lives or dies on the Fibonacci math against a specific swing, and the AI reads a static screenshot rather than raw price data, you draw the retracement over the swing high and swing low using your charting platform's Fibonacci tool before you screenshot; the AI does not calculate the 61.8% or 65% levels itself, does not auto-detect the swing high or swing low, does not scan a live feed for golden-pocket setups, and does not predict whether the bounce will hold. If no Fibonacci retracement tool or zone is visible in the screenshot, it cannot grade the setup at all. You draw the retracement, confirm the pullback is pushing into the zone within a real uptrend, screenshot the chart, and upload it, and the same checklist runs every time so a genuine golden pocket bounce in a healthy uptrend and a shallow pullback with no real trend context get judged the same way.
What the AI Returns From a Screenshot
Use the output as a repeatable pre-trade checkpoint, not a prediction.
A-F Setup Grade
See whether the setup has enough pattern clarity, momentum, volume, and reward to justify the risk.
Entry, Stop, Targets
Get a structured trade plan with entry zone, invalidation level, targets, and risk/reward.
Screenshot-Based Read
Use charts from TradingView, Webull, ThinkOrSwim, MetaTrader, Robinhood, or any broker.
Risk Notes First
The analysis flags extension, messy chop, weak retests, thin reward, and conflicting indicators.
Workflow
Use it as a quality check on the golden pocket pullback
Plenty of golden pocket pullbacks fail when the uptrend above them was already rolling over or the retracement never really reached 61.8%. SnapPChart gives you a consistent read on whether this pullback is worth buying before you take the bounce.
- Draw the Fibonacci retracement tool from the swing low to the swing high of the most recent impulse leg before you screenshot, since the grade has nothing to check the zone against without it visible
- Confirm the broader uptrend above the pullback is genuinely intact, not already rolling over into a top
- Watch for price to pull back into the 61.8%-65% zone specifically, not a shallower or deeper retracement
- Check whether the pullback came on light, drying-up volume or heavier selling that threatens the trend
- Read the candle or price action confirming at the zone before you treat the bounce as real
- Skip the trade when the grade flags a broken uptrend, a retracement that never reached the zone, or no Fibonacci tool visible in the screenshot
Head to head
SnapPChart vs a general AI chat assistant for golden pocket setups
A general AI tool can tell you a pullback looks close to a Fibonacci level, but it will not reliably check that the retracement actually reached the 61.8%-65% zone, that the broader uptrend above it is still intact, or that the pullback is not just a shallow dip, to the same standard twice. SnapPChart reads the Fibonacci retracement zone you drew, the swing it is anchored to, the trend, and the volume the same way on every screenshot you upload.
| Feature | SnapPChart | General AI chat assistant |
|---|---|---|
| Grades the golden pocket zone you drew on the screenshot | Yes, every upload | Inconsistent |
| Reads the Fibonacci retracement tool exactly as drawn | From the image | Varies by prompt |
| Confirms the broader uptrend is genuinely intact above the pullback | Every grade | Rarely |
| Flags a shallow retracement or a trend already rolling over | Every bear case | Rarely flagged |
| Entry, stop, targets off the golden pocket bounce | Yes | Prompting required |
| Same criteria on every golden pocket pullback | Fixed methodology | Varies by session |
Learn the golden pocket setup
Use these guides to understand what makes a golden pocket pullback grade well, so you take the read instead of the output blindly.
What do traders ask about Golden Pocket AI?
How SnapPChart grades a golden pocket pullback from your screenshot.
What is the golden pocket, and where does the term come from?
The golden pocket is the 61.8% to 65% Fibonacci retracement zone, drawn over the swing low to swing high of a recent impulse leg. The term was popularized by Scott Carney, the harmonic trader who also defined patterns like the Gartley and the Bat, and it is now widely used shorthand in crypto and swing-trading circles for that narrow overlap zone. It marks where 0.618, the golden ratio, and 0.65, an approximation of the ratio's square root Carney called the golden mean, sit close enough together to be treated as one tight band rather than two separate levels.
How does the AI grade a golden pocket pullback?
It reads the Fibonacci retracement zone exactly as you drew it over the swing low and swing high, checks whether price is currently pulling back into the 61.8%-65% band, and confirms the broader trend above the pullback is a genuine, established uptrend rather than one already rolling over. It factors in the volume on the pullback and any confirming candle at the zone, then returns a setup grade, an entry on the bounce, a structural stop below the zone, and targets. A pullback that reaches cleanly into the golden pocket inside a strong uptrend on light volume, then confirms with a bounce candle, grades higher than a shallow dip that never reaches 61.8% or a retracement inside a trend that is already breaking down.
Why 61.8% to 65%, specifically?
Because that is where two separate Fibonacci-derived levels sit close enough together to be read as one zone instead of two. 0.618 is the golden ratio itself, the retracement level most traders already watch on any pullback. 0.65 approximates the golden ratio's square root, what Scott Carney termed the golden mean. The overlap of those two levels defines a narrower, more selective pocket than the wider 50%-61.8% band some traders default to, and it is that narrowness, not either level alone, that gives the golden pocket its name and its appeal as a tighter entry zone.
Does the AI calculate the Fibonacci levels or auto-detect the swing points?
No. It does not scan a feed for golden-pocket setups, calculate the 61.8% or 65% levels itself, auto-detect the swing high or swing low, or plot the retracement for you. You mark the swing low and swing high of the impulse leg using your charting platform's Fibonacci retracement tool, so the 61.8% and 65% levels are drawn on the chart, then screenshot and upload that image, and the AI grades what it can see: the zone as drawn, whether price is pulling back into it, the trend above it, the volume, and any confirming candle at the zone. The grade reflects the picture you give it, not an independent Fibonacci calculation.
What should be on the chart before I screenshot it?
Draw the Fibonacci retracement tool from the swing low to the swing high of the most recent impulse leg, so the 61.8% and 65% levels are visible as drawn lines or shading on the chart, along with the candles, timeframe, price scale, and volume. The broader uptrend leading into the swing needs to be visible too, since the grade checks whether that trend is genuinely intact. If only the price action is visible with no Fibonacci tool drawn, the AI has nothing to check the pullback against and cannot grade the setup.
Is the golden pocket a reversal signal or a continuation entry?
On this page, strictly a continuation entry. The golden pocket is drawn over a swing inside a trend that is already up, and the grade is about whether the pullback into that zone is a good place to add to the existing uptrend, not a call that a downtrend is about to reverse. That is different from a harmonic reversal pattern like the Gartley, which uses a five-point XABCD structure across multiple legs to call a turn at the end of a decline. The golden pocket here is a single two-line retracement zone inside a trend already moving in your direction, no reversal call required.
Can it tell a genuine golden pocket bounce from a trend that is already breaking down?
It flags that risk in the bear case. If the broader trend above the pullback shows lower highs forming, the retracement blows through 65% into deeper territory, or the pullback comes on heavy selling volume, the grade drops and the trade plan calls out that the continuation thesis is weaker. A clean pullback that holds inside the 61.8%-65% band, inside a trend still printing higher highs and higher lows, on drying-up volume, grades better.
Is there a free trial for golden pocket grading?
Yes. New users get two lifetime chart analyses. The first shows the full output so you can see exactly what the golden pocket grade returns; the second is gated to show what the paid product adds. No credit card required.
Grade the pullback before you buy the golden pocket bounce.
Draw the Fibonacci retracement over the swing, screenshot the chart with the 61.8%-65% zone visible, and upload it from the homepage for a structured read on the setup.
Grade a Golden Pocket Free