An AI chart detector that shows what it found on your chart, and what that means for the trade.
Upload a chart screenshot and the detector picks out the trend and swing structure, candlestick signals, chart patterns, support and resistance, EMA and VWAP position, MACD momentum, and volume behavior. Then it scores those detections into a setup grade, so you see the evidence and the verdict side by side.
Drag and drop your chart screenshot
or click to browse. PNG, JPG, or WebP.
Your first analysis is free. No credit card.
Make sure both the time axis (X) and price axis (Y) are visible in your screenshot for accurate results.
Grade
B+
Entry
$3.87
Stop
$3.75
Target
$4.24
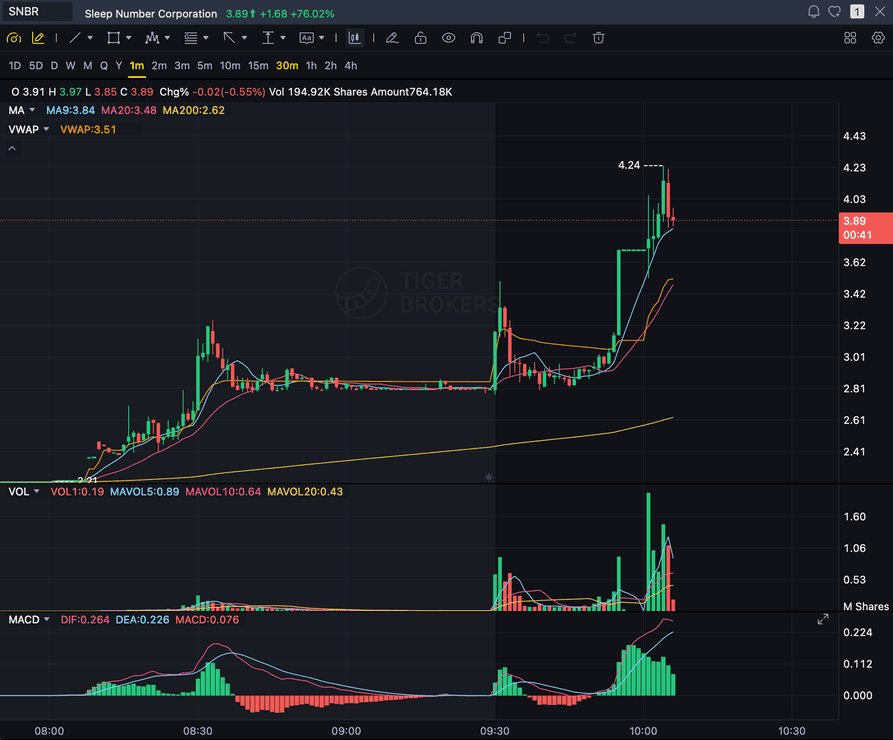
Sample detection read (stock chart)
Detected: an opening push on heavy green volume, a lighter-volume pause that held the rising averages, and a breakout attempt near 3.89. Scored together, those detections produced the grade and levels shown above.
DETECT
Trend, levels, candles, patterns, indicators, volume
SCORE
Detections scored from a baseline of 50
DIRECTION
Long or short continuation, never a reversal call
LIMITS
Image only: no feed, no news, no scanner
Quick answer
What does an AI chart detector actually detect?
An AI chart detector reads a chart screenshot and lists what is on it: trend direction and swing structure, candlestick signals, chart patterns, support and resistance ranges, price against the EMAs and VWAP, MACD momentum, and volume confirmation. SnapPChart then scores those detections into a long or short continuation grade from A+ to F.
The detection step and the grading step are separate on purpose. First the engine extracts facts from the image only, with no opinion attached: where the swing highs and lows are, whether the last break continued the trend or went against it, which levels sit nearest to price, and what the indicators are doing. Only then does it score the setup, starting from a baseline of 50, adding points for confirmations and subtracting them for warnings. Stock charts can land anywhere from A+ to F. Forex, crypto, metals, index, and futures charts are capped at B, because the momentum rules behind the grade were built on stock behavior. Full analyses add an entry, a stop with its reasoning, two targets, and the bear case.
Detections
What the AI chart detector picks up from a screenshot
Every upload goes through the same fact-extraction pass before anything is graded. These are the things it looks for, in the order they feed the grade.
Trend
Trend direction and swing structure
It marks the recent swing highs and swing lows and checks whether they step up (higher highs and higher lows) or step down. It also notes whether the latest break continued the structure or was the first break against it, and whether price is early, mid, or extended in the move.
Candles
Eight scored candlestick signals
Bullish and bearish engulfing, hammer or pin bar, shooting star, doji, morning star, evening star, and topping tail are scored as named signals with a confidence value. Inside bars, rejection wicks, and break-and-retest candles are described in the structure read rather than scored separately.
Patterns
Bull flags, bear flags, and cup and handle
The grading rules look for a pole on heavy volume followed by a tight, low-volume flag, and for cup and handle on long setups. It does not run a classifier for every textbook shape, so triangles, wedges, head and shoulders, and double tops are not named outputs.
Levels
Support, resistance, and key levels
Up to three support and three resistance zones nearest to price, each returned as a small price range rather than a single tick. On stock charts it also notices whole and half dollar levels, and on forex it watches round numbers.
EMA and VWAP
Where price sits against the averages
It reads whether price is holding or losing the 9 and 20 EMA, how they slope, and whether price is above or below VWAP and what it did there recently. A stock trading below VWAP is treated as a disqualifier for a long, and above it for a short.
Momentum
MACD cross, histogram, and zero line
It reads whether the MACD line has crossed its signal line, whether the histogram is expanding or narrowing, and where both sit against zero. A weakening histogram into a level counts as a warning even when the line is still positive.
Volume
Volume confirmation, read before anything else
It compares volume on green candles with volume on red ones and flags spikes with rough multiples. A single red bar at around twice the average or more on a long setup is a hidden seller and drops the chart to F. Volume it cannot read is treated as missing, not weak.
Liquidity
Sweeps, fair value gaps, and order blocks, when visible
If the chart genuinely shows them, it notes a swept high or low, an unfilled fair value gap, or an order block, with prices. It only names a session window when the time axis is legible. If none of these are present, it leaves them blank instead of inventing a zone.
Limits
What an AI chart detector cannot detect
A screenshot is a frozen picture of the past. Anything that is not drawn inside that frame is invisible to the detector, and it is built to say so rather than guess.
Price
No live price or later candles
It sees the chart at the moment you took the screenshot. If price has moved since, the detector does not know. Take a fresh screenshot before you act on a level.
Context
No news, earnings, or fundamentals
Headlines, the earnings calendar, economic releases, valuation, and analyst views are not on a price chart, so none of them are detected. If a catalyst matters to your trade, you have to bring that knowledge yourself.
Order flow
No order book, tape, float, or short interest
Level 2, time and sales, the depth of market, share float, and short interest live outside the chart image. The detector reads the candles and the indicators you plotted, nothing underneath them.
Timeframe
Only the timeframe and history in the frame
It reads the timeframe from the label on the chart and the candles that fit on screen. It does not pull a higher timeframe or older history. If the daily trend matters, upload the daily chart as well.
Forecast
No prediction of where price goes next
A grade measures how well the visible evidence lines up for a continuation trade. It is not a forecast, and an A setup can still fail. That is why every full analysis includes the case against the trade.
Scanning
No market scan and no alerts
It does not search the market for setups, watch a ticker for you, or send an alert when a pattern forms. You find the chart, take the screenshot, and upload it. Then it detects and grades that one chart.
What the detector does with what it finds
Detection is the evidence. These are the four things it turns that evidence into.
Picks a Side, or Says Skip
From the swing structure it chooses long or short in the direction of the established trend. Range-bound or unreadable charts get no direction and a skip, not a forced call.
Scores the Detections
Confirmations add points, warnings subtract them, and disqualifiers end the read. The result is a grade, a total score, a confluence count, and a chart-quality score.
Anchors the Plan to a Level
On full analyses the entry sits at a detected level such as the 9 or 20 EMA, VWAP, or a broken high turned support, with the stop on the far side of it and two targets in the direction of the trade.
Writes the Case Against
Key concerns and a bear case list what would invalidate the setup beyond the stop, so the detections that argue against the trade are on the page too.
How to use it
Get a cleaner detection read from your screenshot
The detector can only find what the image shows. A few minutes of chart setup before you take the screenshot makes the read sharper.
- Keep the symbol and timeframe label inside the frame
- Leave the volume panel visible so volume is not marked missing
- Plot the 9 and 20 EMA, VWAP, and MACD if you use them
- Show enough candles for two or three swing highs and lows
- Upload the higher timeframe separately if trend context matters
- Compare the detections with your own read before you trust the grade
Head to head
An AI chart detector vs reading it yourself or asking a chat assistant
The two usual alternatives each miss something different. Reading a chart by eye catches context a screenshot cannot hold, but the checklist shrinks on a setup you already like. A general AI chat assistant describes the picture, but what it bothers to mention changes with the prompt. A detector runs the same inventory on every upload and then scores it.
| Feature | SnapPChart | Manual chart reading / General AI chat assistant |
|---|---|---|
| Runs the same detection checklist on every chart | Fixed inventory, every upload | By eye: shrinks when rushed. Chat: depends on the prompt |
| Volume read against the candle colour, spikes called out | Green vs red bars, rough multiples | By eye: often skipped. Chat: rarely quantified |
| Support and resistance returned as price ranges | Up to 3 each side of price | By eye: yes, if drawn. Chat: loose wording |
| Turns the detections into a letter grade and a score | Baseline-50 score to a grade | By eye: gut feel. Chat: no fixed scale |
| Entry, stop, and targets tied to a detected level | On full analyses | By eye: yes. Chat: varies between uploads |
| States when a chart has no continuation read | Says skip instead of forcing a side | By eye: hard to admit. Chat: tends to pick a side |
| News, earnings, and anything outside the frame | Not in a screenshot, not detected | By eye: you already know it. Chat: only if you type it in |
Related pages on detection and pattern reading
Go deeper on how the candle read works, or start from the broader chart analysis workflow.
What do traders ask about AI chart detectors?
How the detection pass works, what it misses, and how it becomes a grade.
How does an AI chart detector work?
It works in two passes. The first pass is pure extraction: a vision model looks at your screenshot and writes down objective facts, such as the swing highs and lows, the nearest support and resistance zones, the state of each indicator, the volume pattern, and the visible timeframe. It is told not to grade or recommend anything at this stage. The second pass scores those facts against a fixed list of confirmations, warnings, and disqualifiers, and that score becomes the grade. Keeping the two apart stops a strong opinion from coloring what the detector says it saw.
Is there a free AI chart detector?
Yes. New accounts get two free chart reads with no card. The first shows the full analysis, including entry, stop, and targets. The second shows the grade and the general analysis, so you can judge whether the detection read is worth paying for before you spend anything.
Can it detect chart patterns like triangles or head and shoulders?
Not as named outputs. The grading rules are built around continuation setups, so the patterns it actively looks for are bull and bear flags, a pullback into a moving average or VWAP, a break and retest of a prior level, and cup and handle on long setups. Eight candlestick signals are scored by name. Triangles, wedges, head and shoulders, and double tops are not classified. If one is on your chart, the structure read will still describe the swings and levels that form it, but it will not label the shape for you.
Does the detector work on forex, crypto, and futures charts?
Yes, the detection pass reads any chart image the same way, and on forex it treats volume as tick volume and watches round-number levels. The grade is where asset class matters: stock charts use the full A+ to F range, while forex, crypto, metals, index, and futures charts are capped at B. The momentum rules behind the score were built on stock behavior, so the cap stops the engine from issuing its most confident grades on markets where those rules are weakest.
Why did my chart come back with no direction?
Because the detector found no continuation read either way. It only grades with the established trend: a long in an uptrend or a short in a downtrend. A chart that is chopping sideways, has unreadable structure, or has just topped or bottomed against the trend gets no direction, and the analysis leans toward skipping it. That is a detection result, not an error.
What happens if the volume bars are cut off?
The detector marks volume as missing data and treats it as neutral. It will not mark a chart down for weak volume just because the panel was cropped or too small to compare. You lose the volume confirmation, though, which is one of the strongest inputs to the grade, so it is worth leaving the volume panel in the screenshot.
Can it tell me where price will go next?
No. The detector reports what is on the chart and the grade measures how well that evidence lines up for a continuation trade. Neither is a forecast. A well-graded setup can fail, and a poor one can run. The point is to see the evidence for and against the trade before you size it, not to know the outcome.
Does it scan the market or alert me when a pattern forms?
No. It is not a scanner and it does not watch charts in the background. It only reads the screenshot you upload, at the moment you upload it. Use your own scanner or watchlist to find candidates, then run the screenshot through the detector before you commit to one.
Is this different from the candlestick pattern page?
Yes. The candlestick pattern page goes deep on one part of the read: which candle formations are scored and when a clean candle still makes a poor trade. This page covers the whole detection pass, from trend and levels through indicators and volume, and the list of things a screenshot cannot show. Both lead to the same grade.
See what the detector finds on your chart.
Upload a screenshot, check the detections against your own read, and get the grade before you decide. Two free chart reads, no card needed.
Run the Detector Free