An AI stock chart analyzer for the stock setup you are about to take.
Upload a stock chart screenshot and get a setup grade, entry, stop, targets, reward-to-risk, and the bear case. Any ticker, any timeframe, any charting platform.
Drag and drop your chart screenshot
or click to browse. PNG, JPG, or WebP.
Your first analysis is free. No credit card.
Make sure both the time axis (X) and price axis (Y) are visible in your screenshot for accurate results.
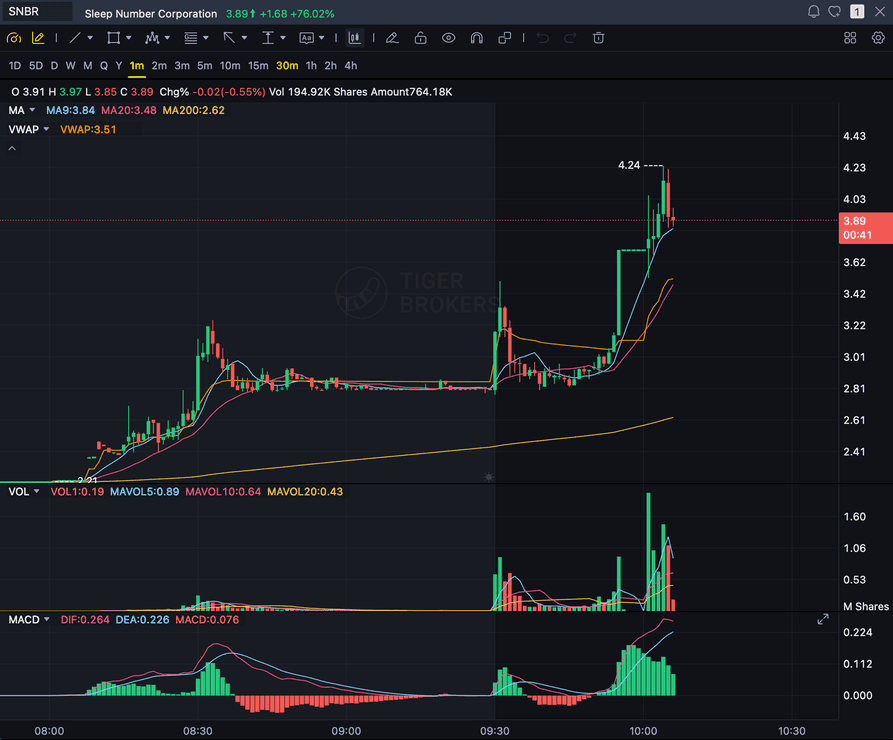
Grade
B+
Entry
$3.87
Stop
$3.75
Target
$4.24
Sample stock chart review
Sample readout: the analyzer grades the stock setup, then returns the entry, a structural stop, targets, the reward-to-risk, and the bear case before position sizing.
STOCKS
Any US equity ticker, any timeframe
GRADE
Full A+ to F range on stock charts
PLAN
Entry, structural stop, and multi-target exits
IMAGE ONLY
No broker login, no live feed, no API key
Quick answer
What does an AI stock chart analyzer do?
An AI stock chart analyzer reads a stock chart screenshot and returns the same structured review every time: pattern and structure, indicator alignment, volume, a setup grade from A+ to F, an entry zone, a stop, multi-target exits, and the bear case. SnapPChart grades the stock setup before you risk capital, using only what is visible on the chart you upload.
It reads the image and nothing else. There is no live quote, no earnings date, no EPS or analyst rating, no options chain, and no broker connection, so the grade reflects the chart in front of you rather than a data feed. It also does not scan for tickers: you bring the stock, it grades the setup. Traders search for this tool under a stack of names, including AI stock chart analysis, stock chart analysis AI, AI analyze stock chart, and stock graph analysis AI. They all describe the same workflow, and the answer to all of them is the same upload box.
What the AI stock chart analyzer returns
The same structured read on every stock chart, so one setup is comparable to the next.
Grades the Trade You Are Taking
Not a generic chart description. The AI trade analyzer grades the specific setup you are about to enter, A+ to F.
Entry, Stop, Targets, R:R
A full trade plan: entry zone, structural stop, multi-target exits, and the reward measured against the risk.
Catches Confirmation Bias
Every analysis returns the bear case and invalidation, so you confront why the trade could fail before you size it.
Reads the Screenshot Directly
No prompting, no broker integration. Upload the chart and the analyzer reads candles, indicators, volume, and levels.
Workflow
Use it on the stock chart you already pulled up
SnapPChart is designed for the decision point after you find a setup and before you enter it. Screenshot the chart, upload it, review the grade, then decide whether the risk is worth it.
- Grade a stock setup before you enter instead of after you are underwater
- Check whether the daily and intraday charts actually agree with your idea
- Size the position off a structural stop rather than a round number
- Read the bear case on your own thesis before you commit capital
- Keep one repeatable standard across every ticker you trade
- Screenshot from any platform: broker, web charting, or a mobile app
Head to head
An AI trade analyzer vs a market scanner
Scanners answer a different question. They surface tickers to look at; an AI trade analyzer grades the one trade you are about to take. Most traders need both, but only one of them tells you whether this setup earned the risk.
| Feature | SnapPChart | A market scanner |
|---|---|---|
| Analyzes the specific trade you are about to take | Yes | Finds tickers instead |
| Setup grade (A+ to F) | Yes | No |
| Entry, stop, targets, and risk/reward | Every analysis | Watchlist only |
| Reads your chart screenshot directly | Every upload | Needs a live data feed |
| Forces the bear case before you size | Every analysis | Not its job |
| Same fields on every trade | Fixed methodology | Varies by filter |
| Works on stocks, forex, crypto, futures | Any screenshot | Depends on the scanner |
| Grade history to review | Yes | No |
Keep Learning the Setup
If your stock idea starts with a chart screenshot, use the primary AI chart analysis workflow and compare the broader tool landscape.
What do traders ask about AI stock chart analysis?
How SnapPChart grades stock chart screenshots before entry.
Is there a free AI stock chart analyzer?
Yes. New users get two free chart analyses, no card required. Upload a stock chart screenshot and SnapPChart returns a setup grade from A+ to F, an entry zone, a stop, multi-target exits, the reward-to-risk, and the bear case. The first analysis shows full depth so you can see exactly what the tool does before deciding whether it is worth paying for.
How does AI stock chart analysis actually work?
You upload a screenshot of a stock chart. The AI reads what is visible in that image: candle structure, trend, volume, support and resistance, and the indicators you have on the chart, including moving averages, VWAP, MACD, and RSI. It then scores the setup against the same criteria every time and returns a structured trade plan. Nothing is inferred from a live feed, which is why the read matches the chart you are looking at.
Can AI analyze a stock chart from a screenshot?
That is the entire workflow. There is no plugin, no broker login, and no API key. Screenshot the chart from whatever platform you already use, drop the image in, and the analysis comes back in seconds. Because it reads the picture rather than a data feed, it works identically whether the chart came from a desktop platform, a browser, or a phone.
Does it read fundamentals, earnings, or analyst ratings?
No, and it will not pretend to. The analyzer reads the chart image only. It does not know the earnings date, the EPS, the float, the short interest, analyst price targets, or anything in the options chain. It is a technical setup grader, so treat the grade as a read on the chart rather than a view on the company.
Is this a stock scanner?
No. A scanner surfaces tickers you have not looked at yet. This grades the chart you already have open. The two work well together: run your scan, then upload the screenshot of anything that looks interesting to get an unemotional second read before you enter.
What grade can a stock chart actually get?
Stock charts can score the full range from A+ down to F. A clean setup with structure, volume, and indicator alignment all pointing the same way earns a high grade and a specific trade plan. A messy or conflicted chart earns a low grade, the same set of fields, and an explicit recommendation to skip it and wait.
Does it work on small caps and low-float movers?
Yes, on the same terms as any other stock chart. It grades what the chart shows: the structure, the volume behaviour, and how far the entry sits from a sensible stop. On a thin low-float chart that often means a worse grade and a wider stop, which is usually the honest answer for that kind of setup.
Which timeframe should I upload?
Whichever one you plan to trade off. The analyzer reads the timeframe from the chart and adapts the entry, stop, and targets to it, so a one-minute scalp and a daily swing both return a plan scaled to that chart. If you are unsure, upload the timeframe you would actually place the order from.
How is this different from the general AI chart analysis page?
Same engine, different starting point. This page is written for traders who are looking specifically at a stock chart, so the examples, the grading range, and the language assume equities. The broader AI chart analysis workflow covers forex, crypto, futures, and metals as well, where the grading is capped differently because those instruments behave differently.
Does the grade change if I upload the same stock chart twice?
The criteria do not change, so the same chart returns a consistent read. That is the point of a fixed output format: your decisions stay comparable from one ticker to the next, and the grade does not soften because you want the trade to work.
Grade the stock setup before you take it.
Upload a stock chart screenshot from the homepage and get a structured second opinion before you risk capital.
Analyze a Stock Chart Free