Grade your LTC chart before you chase Bitcoin's move.
Upload a Litecoin chart screenshot and get a setup grade, entry, stop loss, targets, and risk notes built for one of crypto's oldest altcoins, whose rallies often track Bitcoin's own price action or a halving-driven speculation cycle rather than a strong independent narrative.
Drag and drop your chart screenshot
or click to browse. PNG, JPG, or WebP.
Your first grade is free, no card: it shows the setup's grade and the general read. Entry, stop, targets and the trade plan come with a paid plan.
Make sure both the time axis (X) and price axis (Y) are visible in your screenshot for accurate results.
Market
LTC/USD
Focus
BTC proxy
Read
Structure
Risk
Halving cycle
LTC readout
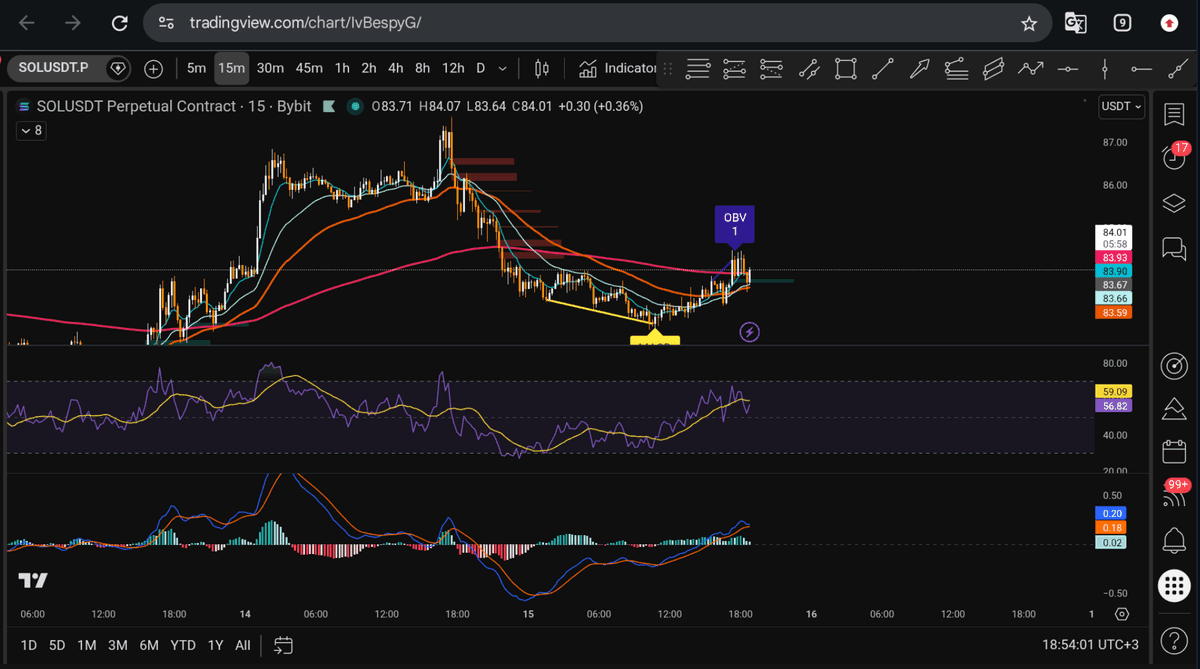
LTC sample analysis: trend structure, dip-buy quality against prior support, extension risk tied to a Bitcoin-driven or halving-cycle spike, and whether the setup still has room to target are checked from the chart itself.
LTC/USD
Spot Litecoin against the US dollar
LTCUSDT
Litecoin paired against Tether on exchanges
LTC PERP
Litecoin perpetual futures charts
LTC/BTC
LTC priced against Bitcoin to check relative strength
Quick answer
Can AI analyze a Litecoin (LTC) chart?
Yes. Upload an LTC chart screenshot from Coinbase, Binance, Kraken, TradingView, or any exchange, and SnapPChart reads the candles, trend, support and resistance, volume, and indicators directly from the image, then returns a setup grade, entry, stop loss, targets, and the bear case. Litecoin launched in 2011 as one of the first forks of Bitcoin's own codebase, earning it the long-running nickname 'the silver to Bitcoin's gold,' and it has served as a real testbed for Bitcoin protocol changes before Bitcoin adopted them, most notably activating SegWit months ahead of Bitcoin's own SegWit activation in 2017. LTC's own trading behavior carries two honesty-relevant risks: it often trades as a higher-beta proxy on Bitcoin's own price action rather than building an independent narrative the way a coin with its own ecosystem story does, so an LTC 'breakout' can just be a delayed echo of a BTC move rather than a structurally distinct setup, and Litecoin's scheduled block-reward halving has produced a documented pattern of sharp pre-halving speculative rallies followed by hard post-halving reversals, most visibly in 2019 and 2023. SnapPChart cannot see where the current halving cycle stands, does not read on-chain data such as hash rate, mining difficulty, or wallet flows, and does not pull a live LTC price feed, so a chart that looks technically extended right after a BTC-driven pump or deep into a halving cycle needs a gut check you have to bring yourself. Litecoin uses proof-of-work mining, not proof-of-stake, so there is no staking yield to calculate on any LTC chart. The grade reflects only the screenshot at the moment you upload it, so re-run it after a fast BTC-driven move or a weekend candle before trusting an older read.
What the AI Returns From a Screenshot
Use the output as a repeatable pre-trade checkpoint, not a prediction.
A-F Setup Grade
See whether the setup has enough pattern clarity, momentum, volume, and reward to justify the risk.
Entry, Stop, Targets
Get a structured trade plan with entry zone, invalidation level, targets, and risk/reward.
Screenshot-Based Read
Use charts from TradingView, Webull, ThinkOrSwim, MetaTrader, Robinhood, or any broker.
Risk Notes First
The analysis flags extension, messy chop, weak retests, thin reward, and conflicting indicators.
When to use it
Grade LTC before a Bitcoin-driven move gets ahead of the chart
LTC can rally hard on Bitcoin's own momentum or a halving-cycle speculation wave before the chart structure has caught up. SnapPChart gives you a fixed checkpoint before you size into the move.
- Check whether an LTC breakout still has room before chasing a Bitcoin-driven or halving-cycle spike
- Grade an LTC pullback into VWAP, EMA, or prior support before adding size
- Cross-check the LTC/USD spot chart against LTC perpetual futures for the same move
- Weigh an extended LTC rally against its history of post-halving reversals before trusting it
- Grade an LTC chart during an alt-season rotation to see whether LTC is leading or lagging BTC and ETH
Head to head
SnapPChart vs a general AI chat assistant for LTC chart analysis
General AI tools can describe an LTC chart, but they will not return the same structured fields twice and will not flag Litecoin's own halving-driven pump-and-dump history or its tendency to trade as a Bitcoin proxy on their own. SnapPChart grades every LTC setup, spot or futures, to the same standard so you can compare a breakout, a dip buy, and a retest on equal footing.
| Feature | SnapPChart | General AI chat assistant |
|---|---|---|
| Reads LTC spot, futures, and LTC/BTC ratio chart screenshots | Yes, every upload | Inconsistent |
| Flags Bitcoin-driven or halving-cycle volatility spikes | Every bear case | Rarely surfaced |
| Names LTC's thin independent narrative instead of treating it like a plain L1 token | Grades the chart shown | May treat it generically |
| Setup grade (A+ to F) | Yes | No |
| Distinguishes a healthy pullback from a real breakdown | Every bear case | Rarely specific |
| Tracks Litecoin's halving-cycle stage, hash rate, or mining difficulty | No, chart structure only | No, also chart-only |
| Grade history to review | Yes, on paid plans | No |
Keep Learning the Setup
Use these guides to understand how SnapPChart grades the trade instead of taking the output blindly.
What do traders ask about LTC Chart Analysis?
How SnapPChart reads Litecoin (LTC) chart screenshots.
Can AI grade a Litecoin (LTC) chart screenshot?
Yes. Upload an LTC chart screenshot from Coinbase, Binance, Kraken, TradingView, or any exchange, and SnapPChart returns a setup grade, entry, stop loss, targets, and a bear case. The AI reads the candles, structure, key levels, and volume from the image itself, the same read whether the chart is spot LTC, a perpetual future, or an LTC/BTC ratio chart.
Does SnapPChart use live LTC price feeds, on-chain data, or mining and hash-rate data?
No. The grade is built entirely from what is visible in the screenshot you upload: candles, indicators, volume, and price levels. SnapPChart does not pull a live LTC price feed and does not read Litecoin's own on-chain or network data, such as hash rate, mining difficulty, or wallet flows. If a level or indicator is not on the chart, it is not part of the grade.
Does SnapPChart track Litecoin's halving cycle or flag pre-halving speculation risk?
No, and this is worth being explicit about. Litecoin's block reward halves roughly every four years, and that schedule has produced a documented pattern of sharp, speculative pre-halving rallies followed by hard reversals once the halving actually hits, most visibly around the 2019 and 2023 halvings. SnapPChart has no way to know where the current halving cycle stands from a chart screenshot, so it cannot flag whether an extended LTC rally is riding that same speculative pattern. Treat the AI's read as a structure check on the chart in front of you, not a halving-cycle check.
Does the AI treat an LTC breakout as its own move, or does it factor in Bitcoin's price action?
SnapPChart grades the chart you upload, not a cross-asset model. Litecoin is one of the oldest Bitcoin forks and has historically traded with a thinner independent narrative than coins built around their own ecosystem story, so LTC often moves as a higher-beta echo of Bitcoin's own price action rather than on a catalyst unique to Litecoin. The read adapts to whatever price action is visible on your LTC screenshot rather than assuming it tracks or diverges from BTC. If you want to check the relationship directly, upload an LTC/BTC ratio chart and grade that the same way.
Is Litecoin proof-of-stake, and does SnapPChart calculate any LTC staking yield?
No. Litecoin uses proof-of-work mining with the scrypt algorithm, the same category as Bitcoin, not proof-of-stake, so there is no staking yield to earn or calculate on an LTC chart in the first place. SnapPChart does not calculate, verify, or reference any staking yield on this page, and it would not do so even for a chart from a product that wrapped LTC in some other yield-bearing structure, since the grade only reads what is drawn on the chart.
Does it work for LTC futures, and is there a spot Litecoin ETF?
Yes for futures: spot LTC/USD, LTCUSDT pairs, perpetual LTC futures, and LTC/BTC ratio charts all work, since SnapPChart reads the chart image, not the instrument type. As of this page's last update, no confirmed live spot Litecoin ETF could be verified on major ETF-tracking platforms, despite an earlier analyst forecast naming Litecoin among coins that could get one, so no ETF market card is listed here; check for a live ticker yourself before assuming one is tradable.
Can AI tell if an LTC dip is a healthy pullback or the start of a deeper breakdown?
The AI grades what the chart shows: whether the dip is basing at a level with confluence and starting to reclaim it, or still breaking down with no structure underneath it. Because LTC often tracks Bitcoin's own moves, an LTC dip can also just be Bitcoin's pullback showing up with extra amplitude, and the grade weighs the structure actually visible rather than assuming every dip behaves the same way. The bear case names the level that would invalidate a healthy-pullback read.
Why re-grade an LTC chart after a fast Bitcoin-driven move or a weekend candle?
An LTC chart can change shape faster than most: a sharp Bitcoin move, a burst of halving-cycle speculation, or an alt-season rotation can pull volume and momentum into LTC within a single session, and LTC also keeps trading through the weekend while broader markets sit closed. A grade only describes the exact screenshot it was given, so a setup that looked clean an hour ago, or before the weekend, is not guaranteed to still look clean now. Upload the current chart rather than trusting an older read.
Is there a free trial to test the Litecoin grader?
Yes. New accounts get one free grade. You see the setup's grade and the general read on your chart. Entry, stop, targets and the trade plan come with a paid plan. No card needed to try it. Test it on a real LTC setup to see how it grades.
Upload your Litecoin chart free.
Get an LTC setup grade, trade plan, and risk notes in seconds.
Analyze an LTC Chart Free