Grade the RSI(2) pullback before you buy the oversold bounce.
Upload a chart with the RSI(2) sub-panel plotted underneath price, the 200-day SMA holding as the trend filter, and RSI(2) closing below 5 on the pullback, and get a read on whether the uptrend above the 200-day SMA is intact, the oversold reading is genuine, the volume, and a full trade plan, so a real oversold pullback in a healthy uptrend and a shallow dip with no real trend context do not get the same benefit of the doubt.
Drag and drop your chart screenshot
or click to browse. PNG, JPG, or WebP.
Your first analysis is free. No credit card.
Make sure both the time axis (X) and price axis (Y) are visible in your screenshot for accurate results.
Grade
B+
Entry
$3.87
Stop
$3.75
Target
$4.24
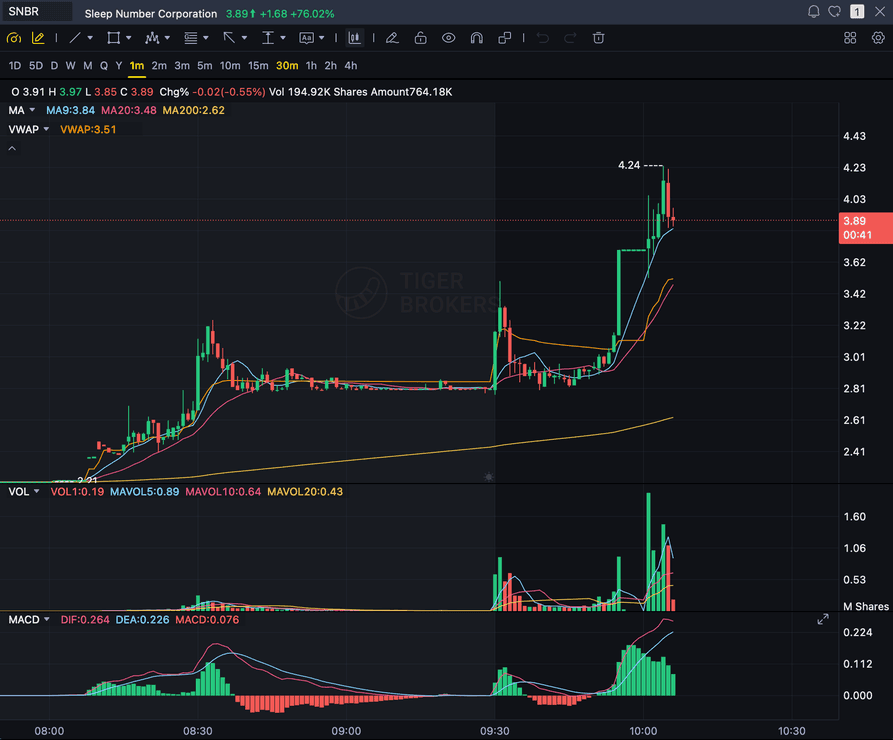
Format example (stock chart)
SNBR 1m bull flag pullback: strong opening momentum, lighter-volume consolidation, and a late breakout attempt near 3.89. Forex, crypto and futures screenshots get the same structure: a grade, entry, structural stop and targets.
RSI(2)
The 2-period RSI sub-panel plotted underneath price
< 5
Connors' classic oversold threshold that triggers the buy signal
200 SMA
The uptrend filter: price must hold above the 200-day SMA
5 SMA
Connors' default exit once price closes back above it
Quick answer
What is an RSI(2) pullback, and can AI grade it?
RSI(2) is Larry Connors' short-term read on the standard Wilder RSI formula, computed on a 2-period lookback instead of the usual 14. Connors introduced it in Street Smarts (1996) and refined it with Cesar Alvarez in Short Term Trading Strategies That Work (2008), and the short lookback makes it swing violently between 0 and 100 on small price moves, so it reads as an immediate how-oversold-right-now gauge rather than a trend-strength gauge the way the standard 14-period RSI does.
Connors' classic full strategy is bidirectional: a buy signal when RSI(2) closes below 5 while price sits above its 200-day SMA, and a mirror short signal when RSI(2) closes above 95 while price sits below its 200-day SMA. This page covers the buy-side half of Connors' own rules, RSI(2) oversold within an established uptrend above the 200-day SMA, which is a legitimate, unmodified subset of the classic strategy, not a distortion of it. Connors' own default exit is closing the position once price closes back above the 5-day SMA, not a fixed RSI(2) level, though some secondary sources describe an RSI(2) crossback above roughly 60 to 70 as a looser approximate alternate exit. SnapPChart grades that buy-side setup from the chart you upload, but it needs the RSI(2) sub-panel visible to do it: it reads the RSI(2) line exactly as it is drawn underneath the price chart in your screenshot, checks the 200-day SMA trend filter, the RSI(2) reading at the pullback, and the volume, then returns a setup grade, an entry on the oversold read, a structural stop, multi-target exits, and the bear case. It reads the oscillator line drawn on your screenshot, not a live RSI(2) calculation, and it cannot grade the setup at all if no RSI(2) sub-panel is visible in the image. It does not scan a live feed for RSI(2) setups, does not calculate RSI(2) itself, does not auto-detect the 200-day SMA for you, and does not predict the next candle. You plot the RSI(2) sub-panel and the 200-day SMA, confirm the pullback pushes RSI(2) below 5 while price holds above the 200-day SMA, screenshot the chart, and upload it, and the same checklist runs every time so a genuine oversold pullback in a healthy uptrend and a shallow dip with no real trend context get judged the same way.
What the AI Returns From a Screenshot
Use the output as a repeatable pre-trade checkpoint, not a prediction.
A-F Setup Grade
See whether the setup has enough pattern clarity, momentum, volume, and reward to justify the risk.
Entry, Stop, Targets
Get a structured trade plan with entry zone, invalidation level, targets, and risk/reward.
Screenshot-Based Read
Use charts from TradingView, Webull, ThinkOrSwim, MetaTrader, Robinhood, or any broker.
Risk Notes First
The analysis flags extension, messy chop, weak retests, thin reward, and conflicting indicators.
Workflow
Use it as a quality check on the oversold bounce
Plenty of RSI(2) pullbacks fail when the 200-day uptrend is not really intact or the oversold reading is not a genuine sub-5 print. SnapPChart gives you a consistent read on whether this pullback is a real buy-the-dip setup before you take it.
- Plot the RSI(2) sub-panel underneath price and the 200-day SMA before you screenshot, since the grade has nothing to check the oversold read against without them
- Confirm price is holding above the 200-day SMA, so the uptrend context Connors' rules require is actually there
- Check that RSI(2) is genuinely closing below 5 on the pullback, not just dipping into the 20s or 30s
- Read whether the pullback came on light volume or a heavier sell-off that threatens the broader trend
- Watch for the exit: Connors' default is closing the position once price closes back above the 5-day SMA
- Skip the trade when the grade flags a broken 200-day trend, a shallow RSI(2) reading, or a missing oscillator panel
Head to head
SnapPChart vs a general AI chat assistant for RSI(2) pullback setups
A general AI tool can tell you RSI looks low, but it will not reliably check that RSI(2) actually closed below 5, that price is still holding above the 200-day SMA, or that the reading is not just a shallow dip into the 20s or 30s, to the same standard twice. SnapPChart reads the RSI(2) sub-panel you plotted, the 200-day SMA trend filter, the pullback, and the volume the same way on every screenshot you upload.
| Feature | SnapPChart | General AI chat assistant |
|---|---|---|
| Grades the RSI(2) pullback you marked on the screenshot | Yes, every upload | Inconsistent |
| Reads the RSI(2) sub-panel plotted underneath price | From the image | Varies by prompt |
| Confirms price is holding above the 200-day SMA trend filter | Every grade | Rarely |
| Flags a shallow RSI(2) dip or a 200-day trend already rolling over | Every bear case | Rarely flagged |
| Entry, stop, targets off the oversold pullback | Yes | Prompting required |
| Same criteria on every RSI(2) reading | Fixed methodology | Varies by session |
Learn the RSI(2) pullback setup
Use these guides to understand what makes an RSI(2) pullback grade well, so you take the read instead of the output blindly.
What do traders ask about RSI(2) Pullback AI?
How SnapPChart grades an RSI(2) pullback from your screenshot.
How does the AI grade an RSI(2) pullback?
It reads the RSI(2) sub-panel plotted underneath the price chart in your screenshot, checks that RSI(2) is genuinely closing below 5 on the pullback, and confirms price is holding above the 200-day SMA, the trend filter Connors' methodology is built on. It factors in the volume on the pullback and the broader structure above the 200-day SMA, then returns a setup grade, an entry on the oversold read, a structural stop, and targets. A pullback that closes RSI(2) cleanly below 5 while price sits comfortably above the 200-day SMA grades higher than a shallow dip into the 20s or 30s, or a pullback where the 200-day trend is already rolling over. This grades the single-day RSI(2) reading Connors' original rules use, not the Cumulative RSI(2) variant some traders layer on top, which sums the oscillator over roughly three days and requires the total below about 20 for a deeper, more sustained oversold read.
How is an RSI(2) pullback different from an EMA pullback?
The two setups are defined by completely different things, even though both are trend-continuation buys. An EMA pullback is defined geometrically: price physically returns to touch or bounce a specific moving-average line, usually the 9 or 20 EMA, and the setup lives or dies on that proximity to the line. An RSI(2) pullback is defined by an oscillator reading: how oversold the last couple of closes are, RSI(2) closing below 5, completely independent of where price sits relative to any single moving-average line. Price can be nowhere near the 20 EMA and still print RSI(2) below 5 after a run of down closes inside an uptrend above the 200-day SMA. Grade the setup that actually matches your chart: if you are watching for a bounce off a specific EMA line, use the EMA pullback page; if you are watching how oversold RSI(2) is getting on the pullback, use this page.
Why does the RSI(2) sub-panel need to be in the screenshot?
Because the entire setup is defined by the RSI(2) reading at the pullback, and there is nothing to grade without it visible. Plot the RSI(2) oscillator, a 2-period RSI, not the standard 14-period default, as a sub-panel underneath your price chart, along with the 200-day SMA on the price panel, before you screenshot. If you only screenshot the price chart with no RSI(2) sub-panel, SnapPChart cannot check the oversold reading at all and cannot grade the setup, since it has no oscillator line to read.
Does SnapPChart calculate RSI(2) itself, or read it from the screenshot?
It reads the RSI(2) line exactly as it is drawn in the sub-panel of the screenshot you upload. This is a different verification model than most of SnapPChart's price-action setups: it does not calculate RSI(2) itself from price data, does not read a live oscillator value, and does not plot the sub-panel or the 200-day SMA for you. Set your charting platform's RSI period to 2 instead of the default 14, plot the 200-day SMA, then screenshot and upload once both are visible.
Does it grade the short side of Connors' RSI(2) strategy?
No. Connors' original rules are bidirectional: the mirror short signal is RSI(2) closing above 95 while price sits below its 200-day SMA. This page covers the buy-side half of Connors' own rules, RSI(2) oversold within an established uptrend above the 200-day SMA. That is a legitimate, unmodified subset of the classic strategy, not a distortion of it, but the short-side mirror setup is out of scope and not graded here.
What is Connors' exit rule for an RSI(2) pullback?
Connors' own default exit is closing the position once price closes back above the 5-day SMA, not a fixed RSI(2) level. Some secondary sources describe an alternate exit around RSI(2) crossing back above roughly 60 to 70, but that is a looser approximation, not Connors' canonical rule. SnapPChart's trade plan uses the structural stop and multi-target exits it returns with every grade; the 5-day SMA reclaim is the classic discretionary exit to watch for on top of that.
Does SnapPChart scan for RSI(2) setups, or read live price?
No. It does not scan a watchlist or the market for RSI(2) pullbacks, does not calculate the 2-period RSI from a live feed, watch the tape, or predict the next candle. You plot the RSI(2) sub-panel and the 200-day SMA, confirm the oversold read yourself, screenshot the chart, and upload it, and the AI grades exactly what is in that image: the RSI(2) reading, the 200-day SMA trend filter, and the volume. The grade reflects the picture you give it.
Is there a free trial for RSI(2) pullback grading?
Yes. New users get two lifetime chart analyses. The first shows the full output so you can see exactly what the RSI(2) pullback grade returns; the second is gated to show what the paid product adds. No credit card required.
Grade the pullback before you buy the oversold bounce.
Plot the RSI(2) sub-panel and the 200-day SMA, screenshot the chart, and upload it from the homepage for a structured read on the setup.
Grade an RSI(2) Pullback Free