Grade your CAD/JPY setup on a cross with no shared home session.
CAD/JPY pairs a currency whose trading day starts in Tokyo against one that barely wakes up until Toronto and New York desks open hours later, so the two legs almost never move on the same clock. A quiet stretch through the European morning is where a thin, low-participation drift is most likely to get mistaken for a genuine setup. Upload a CAD/JPY chart screenshot and SnapPChart checks the pullback against the 9 and 20 EMA, whether the candles are respecting a round-number level, and whether the tick volume actually confirms the move, then hands back a setup grade, an entry, a stop, and staged targets weighed against the risk.
Drag and drop your chart screenshot
or click to browse. PNG, JPG, or WebP.
Your first analysis is free. No credit card.
Make sure both the time axis (X) and price axis (Y) are visible in your screenshot for accurate results.
Grade
B+
Entry
$3.87
Stop
$3.75
Target
$4.24
Sample readout
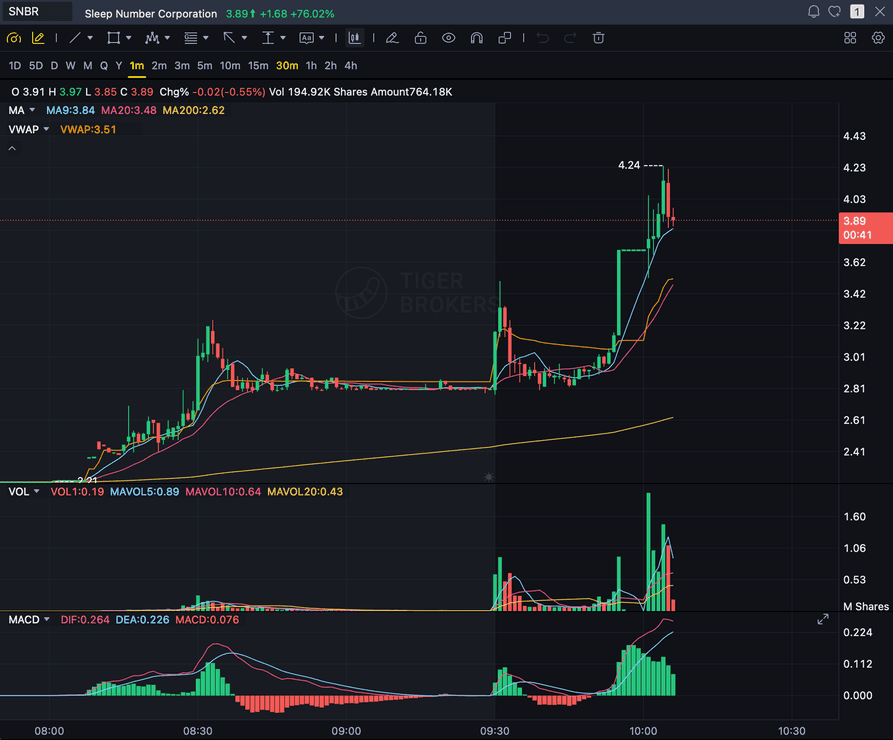
SNBR 1m bull flag pullback: strong opening momentum, lighter-volume consolidation, and a late breakout attempt with the 3.89 price marker near the current candle.
CAD/JPY
No USD leg, and the two sides rarely share a session
TOKYO OPEN
The yen side runs on the Asian session clock
EMA
Pullback into the 9 and 20 EMA on a clean trend
NY / TORONTO
The loonie side wakes with oil and Bank of Canada data
Quick answer
How do you analyze a CAD/JPY chart with AI?
Send SnapPChart a screenshot of your CAD/JPY chart and it comes back within seconds with an A+ through F grade, an entry, a stop built from the chart's own structure, staged exit targets, and the reward measured against the risk. What sets this cross apart from a euro-yen or pound-yen pair is timing: the yen side is driven by the Tokyo session, while the loonie side stays quiet until North American trading gets underway and oil prices or a Bank of Canada release start moving it, so the two legs of CAD/JPY rarely share an active window the way a European currency and the yen do during the London session. That leaves a comparatively dead stretch through the European morning where neither side has a natural home-session advantage, and a setup shaped mostly by that quiet gap can pass for something built on real order flow once it reaches the candles. Interest rates matter here too, though less dramatically than traders sometimes assume: Canada has usually carried a modest rate edge over Japan, not the wider gap the Australian or New Zealand dollar has carried, so CAD/JPY does not trade with the same reputation as a risk-on or risk-off barometer that AUD/JPY has built. None of that session or rate context reaches the grader. It works from the screenshot alone, the EMA pullback, the round-number reaction, and the tick volume, and judges every CAD/JPY chart against those same fields regardless of which session or macro story produced the move.
What the AI Returns From a Screenshot
Use the output as a repeatable pre-trade checkpoint, not a prediction.
A-F Setup Grade
See whether the setup has enough pattern clarity, momentum, volume, and reward to justify the risk.
Entry, Stop, Targets
Get a structured trade plan with entry zone, invalidation level, targets, and risk/reward.
Screenshot-Based Read
Use charts from TradingView, Webull, ThinkOrSwim, MetaTrader, Robinhood, or any broker.
Risk Notes First
The analysis flags extension, messy chop, weak retests, thin reward, and conflicting indicators.
Workflow
Use it as a pre-entry gate on every CAD/JPY setup
A CAD/JPY pullback built during the quiet gap between the Tokyo close and the North American open can look just as clean on the candles as one backed by real Tokyo or New York participation, and the chart alone will not tell you which is which. SnapPChart runs the same structural check on every CAD/JPY setup regardless of when it printed.
- Grade a CAD/JPY pullback into the 9 or 20 EMA before the entry
- Check the round-number level the loonie-yen cross is reacting to
- Rule out a low-participation drift dressed up as a real pullback
- Weigh the tick volume behind the pullback before trusting it
- Read the bear case and invalidation before committing size
- Skip C-grade CAD/JPY setups where the reward is not there
Head to head
SnapPChart vs a general AI chat assistant for chart screenshots
Most traders land here after pasting a chart into a general AI tool and getting a vague description. Here is how a purpose-built screenshot grader compares for the last decision before you risk money.
| Feature | SnapPChart | General AI chat assistant |
|---|---|---|
| Reads any chart screenshot | Every upload | Inconsistent |
| Setup grade (A+ to F) | Yes | No |
| Entry, stop, and targets | Every upload | Varies by prompt |
| Same criteria every time | Fixed methodology | Varies by prompt |
| Multi-target exit plan (T1 / T2) | Yes | Rarely consistent |
| Risk/reward + invalidation | Yes | Inconsistent |
| Speed to a decision | Seconds | Prompting required |
| Grade history to review | Yes | No |
Keep Learning the Setup
Use these guides to understand how SnapPChart grades the trade instead of taking the output blindly.
What do traders ask about CAD/JPY Chart Analysis?
How SnapPChart grades a CAD/JPY chart from a screenshot.
How do I analyze a CAD/JPY chart with AI?
Screenshot your CAD/JPY chart from whichever platform you trade on and upload it to SnapPChart. A multimodal vision model reads the pullback into the 9 and 20 EMA, the round-number reaction, and the visible tick volume straight from the image, then returns a setup grade, an entry, a stop, staged targets, and the reward against the risk. Nothing needs to be typed in and no data feed gets connected; the screenshot carries the whole analysis.
Does it read live CAD/JPY prices, oil prices, or the Bank of Japan and Bank of Canada calendar?
No. Everything the grader knows comes from the screenshot you upload. It does not read live CAD/JPY prices, does not track crude oil prices, does not pull the Bank of Japan or Bank of Canada policy calendar, and does not cross-reference other currency pairs. The Tokyo-versus-North America session split and the loonie's oil exposure are useful background for you as the trader; the grader sticks to what's visible on the chart, the EMA pullback, the round numbers, and the tick volume.
Why doesn't CAD/JPY share one clear trading session the way a euro-yen or pound-yen cross does?
EUR/JPY and GBP/JPY both get a dependable trending window because a European currency's home session sits opposite the Tokyo close, giving the pair one obvious stretch where both legs are actively traded. CAD/JPY doesn't get that handoff. The yen side is busiest during the Asian session, and the loonie side does not really wake up until Toronto and New York desks open several hours later, when oil prices and Bank of Canada data start to matter. That leaves the European morning as a comparative dead zone for this specific cross, since neither the Japanese nor the Canadian economy has a natural session advantage there. A pullback that prints in that quiet window can carry the same shape on a chart as one built on genuine Tokyo or New York participation, and the grader applies one fixed structural check no matter which half of the day produced it.
Is CAD/JPY a carry-trade pair the way AUD/JPY is?
Only loosely. The yen is the currency most commonly cited as a classic low-yield funding currency in carry trades, and that part of the picture holds for CAD/JPY same as any other yen cross. But the Canadian dollar is not usually described as a funding currency itself, and the interest-rate gap it has carried over the yen has historically run considerably shallower than the gap Australia or New Zealand has carried, the setup that gives AUD/JPY and NZD/JPY their reputation as risk-sentiment barometers. That shallower gap is a big part of why CAD/JPY doesn't trade with the same clean risk-on or risk-off character. None of that rate math factors into the score you get back. The grader is still just reading candles: the pullback shape, the round numbers, and the volume printed on your screenshot, on the same fixed rubric every time.
Are the entry, stop, and targets in pips?
Yes. Like every yen cross, CAD/JPY prices to two or three decimal places, so a pip is worth 0.01, and the grader hands back the entry, the structural stop, and each target in that unit next to the raw price, with the payoff sized against the risk once spread is factored in. Because a meaningful chunk of this pair's volume only shows up once North American desks are active, double-check that the stop width still matches your own account risk before committing to the trade.
Can it grade a CAD/JPY short setup?
SnapPChart grades long and short momentum-continuation setups from chart screenshots. Choose Long only, Short only, or Both sides in your trading profile. Both sides picks one direction from the chart.
Is CAD/JPY chart analysis free to try?
Yes. New users get two lifetime chart analyses, no credit card required. The first analysis shows the full depth so you can see exactly what the AI returns from a CAD/JPY chart; the second is gated to show what the paid product adds.
Grade your next CAD/JPY setup before you enter.
Upload the loonie-yen screenshot from the homepage and get a structured read on the CAD/JPY setup in seconds. No credit card required.
Grade a CAD/JPY Chart Free