Grade your EUR/NZD setup on one of the wider-swinging major crosses.
Two very different interest-rate stories sit on either side of this pair, and that gap has made EUR/NZD a pair that can move a lot more per day than a typical major. Upload your euro-kiwi chart screenshot and SnapPChart works through the pullback shape into the 9 and 20 EMA, the round-number levels this pair likes to react to, and the tick volume printed on the candles, before handing back a setup grade, an entry, a stop, and staged targets with the risk weighed against the reward, sized for a pair whose swings run wider than most on the board.
Drag and drop your chart screenshot
or click to browse. PNG, JPG, or WebP.
Your first grade is free, no card: it shows the setup's grade and the general read. Entry, stop, targets and the trade plan come with a paid plan.
Make sure both the time axis (X) and price axis (Y) are visible in your screenshot for accurate results.
Grade
B+
Entry
$3.87
Stop
$3.75
Target
$4.24
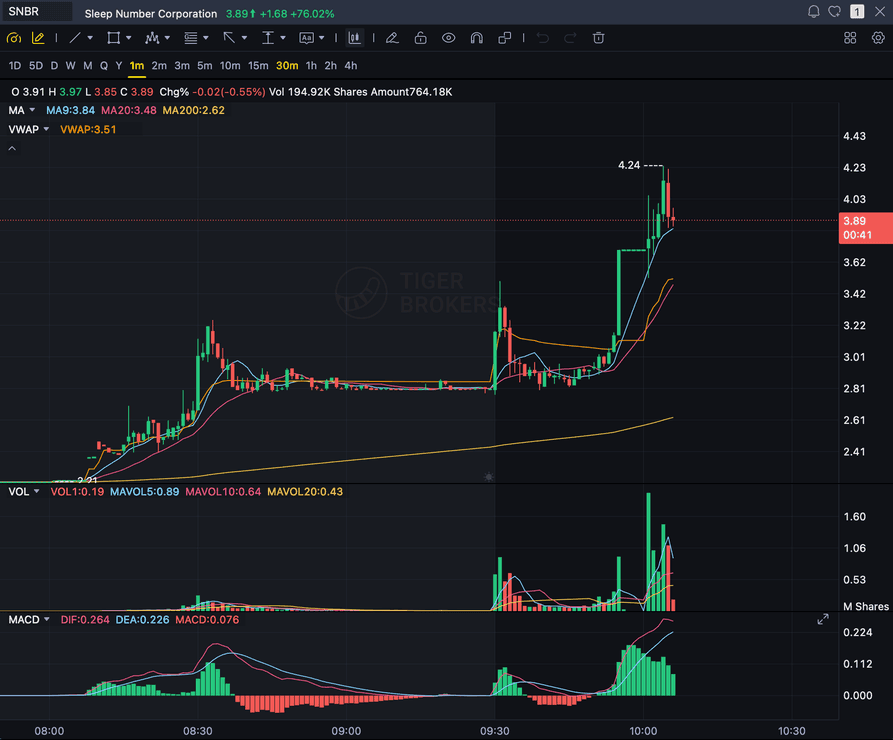
Format example (stock chart)
SNBR 1m bull flag pullback: strong opening momentum, lighter-volume consolidation, and a late breakout attempt near 3.89. Forex, crypto and futures screenshots get the same structure: a grade, entry, structural stop and targets.
EUR/NZD
The euro-kiwi cross, no USD leg
RATE GAP
RBNZ hiked early; ECB held near zero far longer
EMA
Pullback into the 9 and 20 EMA on a clean trend
WIDE RANGE
Moves more per session than most major pairs
Quick answer
How do you analyze a EUR/NZD chart with AI?
Upload a screenshot of your EUR/NZD chart and SnapPChart hands back a grade in seconds: A+ through F, an entry, a stop built off visible chart structure, staged exit targets, and the reward measured against the risk. The Reserve Bank of New Zealand was among the first developed-market central banks to start lifting rates once the post-pandemic recovery took hold, while the European Central Bank kept Eurozone rates near zero or below for years longer. That gap turned EUR/NZD into a pair traders use to fund a position in one currency with the other, and positions built that way have a track record of unwinding fast whenever risk appetite turns, the kind of move that showed up during the 2008 financial crisis and again in the March 2020 selloff. The practical result on the chart is a cross that typically covers more ground in a single session than a EUR/USD or EUR/GBP does, which changes what a sensible stop and target even look like here. None of the rate-differential story reaches the grader directly. It reads the pullback shape into the 9 and 20 EMA, the round-number levels visible on the chart, and the tick volume printed on the candles, scoring every EUR/NZD setup against the same fixed rubric regardless of what central banks are doing that week. Live quotes, the RBNZ or ECB calendar, and rate-decision headlines all stay outside what it reads; the screenshot is the only input.
What the AI Returns From a Screenshot
Use the output as a repeatable pre-trade checkpoint, not a prediction.
A-F Setup Grade
See whether the setup has enough pattern clarity, momentum, volume, and reward to justify the risk.
Entry, Stop, Targets
Get a structured trade plan with entry zone, invalidation level, targets, and risk/reward.
Screenshot-Based Read
Use charts from TradingView, Webull, ThinkOrSwim, MetaTrader, Robinhood, or any broker.
Risk Notes First
The analysis flags extension, messy chop, weak retests, thin reward, and conflicting indicators.
Workflow
Use it as a pre-entry gate on every EUR/NZD setup
A pair that regularly covers this much ground per session makes normal-pair stop and target sizing a bad habit fast. SnapPChart gives you a consistent quality check on the EUR/NZD chart before you size the trade.
- Grade a EUR/NZD pullback into the 9 or 20 EMA before the entry
- Check the round-number level the euro-kiwi cross is reacting to
- Confirm the stop and target actually fit this pair's wider swings
- Weigh the tick volume behind the pullback before trusting it
- Read the bear case and invalidation before you commit size
- Pass on C-grade EUR/NZD setups where the reward doesn't clear the risk
Head to head
SnapPChart vs reading a EUR/NZD chart by hand
EUR/NZD covers more ground in a session than EUR/USD or EUR/GBP, and carry unwinds can turn it fast. The by-hand trap is sizing stops and targets with habits built on a quieter pair. SnapPChart reads the pullback depth and swing size on the chart and sizes the plan from that.
| Feature | SnapPChart | Reading the chart by hand |
|---|---|---|
| Stop distance fitted to EUR/NZD's wider swings | From visible structure | Major-pair habits |
| Reads a reversal volume spike against the pullback | When on the chart | Easy to rationalise |
| Pullback depth graded on a wide-range cross | Every upload | Feel-based |
| Pip targets that respect the larger euro-kiwi range | T1 / T2 from swings | Often too close |
| RBNZ versus ECB rate context | Not read | You track it |
| Bear case before committing size on a fast cross | Every paid grade | Skipped in a hurry |
| Grade history for euro-kiwi setups | Stored per chart | Journal only |
Keep Learning the Setup
Use these guides to understand how SnapPChart grades the trade instead of taking the output blindly.
What do traders ask about EUR/NZD Chart Analysis?
How SnapPChart grades a EUR/NZD chart from a screenshot.
How do I analyze a EUR/NZD chart with AI?
Take a screenshot of your EUR/NZD chart and upload it to SnapPChart. The vision model reads the pullback shape into the 9 and 20 EMA, the round-number levels, and the tick volume directly from the image, then returns a grade with an entry, a stop, targets, and the reward against the risk. There is no manual data entry and no feed to connect; the picture is the entire input.
Does it read live EUR/NZD prices, the RBNZ calendar, or rate decisions?
No. The grader works from the screenshot you upload, not a live feed. It does not read live EUR/NZD prices, does not pull the Reserve Bank of New Zealand or European Central Bank policy calendar, and does not track rate-decision headlines or carry-trade positioning. The interest-rate gap between the two economies is useful background for you as a trader; the grader isn't built to weigh it, so it sticks to the structure, the EMA pullback, the round numbers, and the volume it can see on the chart.
Why does EUR/NZD move more per session than most major pairs?
The Reserve Bank of New Zealand and the European Central Bank have spent long stretches pulling in opposite directions on interest rates, and that gap turns EUR/NZD into a pair traders use to borrow cheaply in one currency and hold the other for the rate difference. Those positions tend to unwind quickly whenever risk sentiment shifts, which is part of why the pair has a history of sharper moves than a EUR/USD or GBP/USD, including during the 2008 crisis and the March 2020 crash. The grader doesn't price in rate differentials, but it does read the structure that results from them: a wider pullback, a bigger stop distance, and volume that can spike hard on a reversal.
Are the entry, stop, and targets in pips?
Yes, alongside the raw prices. Like most non-yen crosses, EUR/NZD prices to four or five decimal places, so one pip works out to 0.0001, and the grader hands back the entry, the stop, and each target in that pip format with the reward-to-risk calculated the same way. The one thing worth flagging on this pair specifically: because it travels further in a session than most majors, expect the stop distance to run wider than what the same setup would need on EUR/USD.
Can it grade a EUR/NZD short setup?
SnapPChart grades long and short momentum-continuation setups from chart screenshots. Choose Long only, Short only, or Both sides in your trading profile. Both sides picks one direction from the chart.
Is EUR/NZD a carry-trade pair?
It's often described that way. New Zealand has more frequently carried a comparatively higher policy rate than the Eurozone over the past several years, the setup that draws in carry-trade positioning, and those positions have a history of reversing hard and fast once global risk appetite sours. None of that rate math factors into the score you get back, though. Whatever the current gap between the RBNZ and ECB happens to be, the grader is still just looking at candles: the pullback shape, the round numbers, and the volume printed on your screenshot, weighed on the same fixed rubric every time.
Is EUR/NZD chart analysis free to try?
Yes. New accounts get one free grade. You see the setup's grade and the general read on your chart. Entry, stop, targets and the trade plan come with a paid plan. No card needed to try it. Upload a EUR/NZD chart to see how it reads the setup.
Grade your next EUR/NZD setup before you enter.
Drop the euro-kiwi screenshot in from the homepage and get back a graded setup, an entry, a stop, and targets sized for this pair's swings, in seconds. Your first grade is free, no card: it shows the setup's grade and the general read.
Grade a EUR/NZD Chart Free