Grade your NZD/JPY setup before New Zealand opens the trading day.
Wellington is one of the first financial centers anywhere to open each trading day, hours ahead of Sydney and further still ahead of Tokyo, so a NZD/JPY chart can already be moving before most of the world's desks are even at their screens. New Zealand is also one of the smallest economies behind a G10 currency, which tends to mean thinner books and sharper single-print moves than a bigger pair shows on the same size order. Upload your NZD/JPY chart screenshot and SnapPChart reads the pullback into the 9 and 20 EMA, the round-number levels the kiwi-yen cross tends to react to, and the tick volume printed on the candles, then returns a setup grade, an entry, a stop, and staged targets weighed against the risk.
Drag and drop your chart screenshot
or click to browse. PNG, JPG, or WebP.
Your first grade is free, no card: it shows the setup's grade and the general read. Entry, stop, targets and the trade plan come with a paid plan.
Make sure both the time axis (X) and price axis (Y) are visible in your screenshot for accurate results.
Grade
B+
Entry
$3.87
Stop
$3.75
Target
$4.24
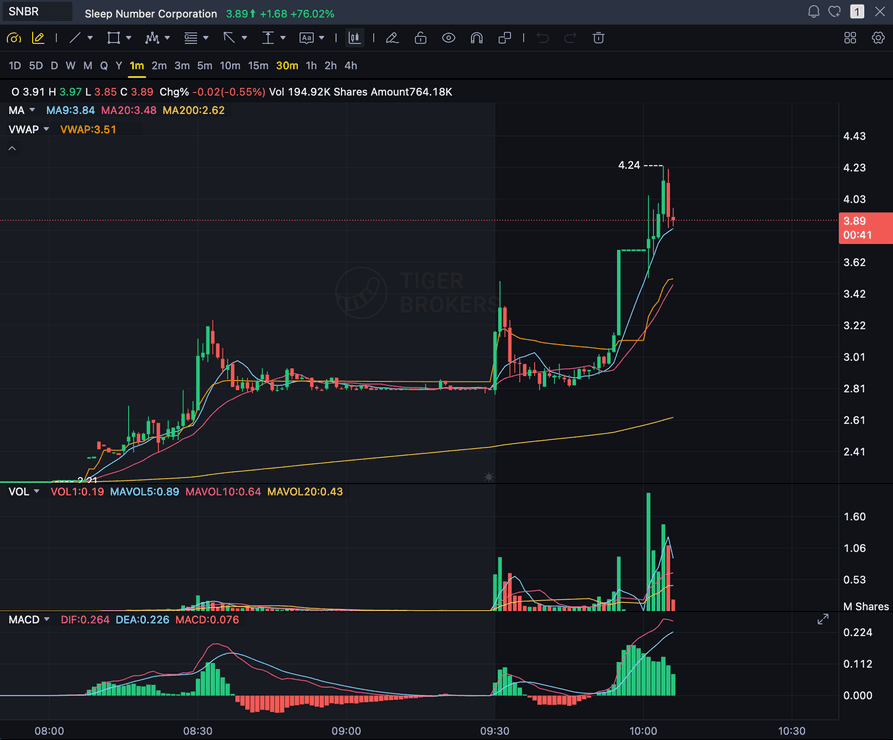
Format example (stock chart)
SNBR 1m bull flag pullback: strong opening momentum, lighter-volume consolidation, and a late breakout attempt near 3.89. Forex, crypto and futures screenshots get the same structure: a grade, entry, structural stop and targets.
NZD/JPY
No USD leg, one of the first crosses moving each day
WELLINGTON OPEN
Among the first sessions open worldwide each day
EMA
Pullback into the 9 and 20 EMA on a clean trend
THIN BOOK
A smaller economy behind the currency, sharper single-print moves
Quick answer
How do you analyze a NZD/JPY chart with AI?
Upload a screenshot of your NZD/JPY chart and SnapPChart hands back a grade within seconds: A+ through F, an entry, a stop built off the structure visible in the image, staged exit targets, and the reward weighed against the risk. New Zealand's session is among the first to open anywhere in the world each trading day, well before Sydney and hours ahead of Tokyo, so this cross can already be in motion while most other markets are still closed, and the Tokyo session joining a few hours later is often the first real liquidity the move gets tested against. New Zealand also carries one of the smaller economies behind any G10 currency, and that size shows up as thinner order books than a pair like AUD/JPY or EUR/JPY carries, so a single headline or a light data print can move NZD/JPY further than the same-size order would move a bigger pair. None of that reaches the grader directly. It reads what's visible on the screenshot, the EMA pullback, the round-number reaction, and the tick volume, and scores every NZD/JPY setup against the same criteria, whether the move started in Wellington's early hours or Tokyo's afternoon. It does not read live NZD/JPY prices, does not track the Reserve Bank of New Zealand or Bank of Japan policy calendar, does not read New Zealand's dairy export or agricultural data, and does not cross-reference the NZD/USD or USD/JPY legs.
What the AI Returns From a Screenshot
Use the output as a repeatable pre-trade checkpoint, not a prediction.
A+ to F Setup Grade
See whether the setup has enough pattern clarity, momentum, volume, and reward to justify the risk.
Entry, Stop, Targets
Get a structured trade plan with entry zone, invalidation level, targets, and risk/reward.
Screenshot-Based Read
Use charts from TradingView, Webull, ThinkOrSwim, MetaTrader, Robinhood, or any broker.
Risk Notes First
The analysis flags extension, messy chop, weak retests, thin reward, and conflicting indicators.
Workflow
Use it as a pre-entry gate on every NZD/JPY setup
A move that starts while most of the world's desks are still closed can look identical on the chart to one built during the busier Tokyo hours, and knowing which session it started in doesn't change what a clean structural setup looks like. SnapPChart gives you a consistent quality check on the NZD/JPY chart before you commit.
- Grade a NZD/JPY pullback into the 9 or 20 EMA before the entry
- Confirm the pullback is reacting to an actual whole-figure level on NZD/JPY, not just noise
- Confirm the structure holds up rather than a thin-book spike that reverses
- Weigh the tick volume behind the pullback before trusting it
- Read the bear case and invalidation before committing size
- Pass on C-grade NZD/JPY setups where the reward doesn't clear the risk
Head to head
SnapPChart vs reading a NZD/JPY chart by hand
NZD/JPY starts moving while most desks are closed, and New Zealand's smaller economy means thinner books than AUD/JPY or EUR/JPY. Thin books print spikes that reverse, and by hand a spike can look like a breakout. The grader checks whether the structure and volume actually back it.
| Feature | SnapPChart | Reading the chart by hand |
|---|---|---|
| Separates a thin-book spike from real structure on NZD/JPY | Structure plus volume | Spikes look convincing |
| Whole-figure reaction on the kiwi-yen cross | When visible on chart | Hard to judge |
| 0.01 pip structural stop on a fast kiwi-yen chart | Every paid grade | Tight by habit |
| Same read whether the pullback formed early or in Tokyo hours | Fixed rubric | Session bias creeps in |
| Early Wellington open context | Not in a screenshot | You know the clock |
| Bear case for a thin cross before sizing | Every paid grade | Often skipped |
| Time from screenshot to plan | Seconds | Several minutes |
Keep Learning the Setup
Use these guides to understand how SnapPChart grades the trade instead of taking the output blindly.
What do traders ask about NZD/JPY Chart Analysis?
How SnapPChart grades a NZD/JPY chart from a screenshot.
How do I analyze a NZD/JPY chart with AI?
Screenshot your NZD/JPY chart and upload it to SnapPChart. The vision model reads the pullback into the 9 and 20 EMA, the round-number levels, and the tick volume straight from the image, then hands back a grade with an entry, a stop, targets, and the reward against the risk. Nothing needs to be typed in and no data feed gets connected; the screenshot carries the whole analysis.
Does it read live NZD/JPY prices, the RBNZ, or the Bank of Japan?
No. Everything the grader knows comes from the screenshot you upload. It does not read live NZD/JPY prices, does not pull the Reserve Bank of New Zealand or Bank of Japan policy calendar, does not read New Zealand's dairy or agricultural export data, and does not cross-reference other currency pairs, including the NZD/USD or USD/JPY legs. The early Wellington open and the thinner liquidity behind the New Zealand dollar are useful background for you as the trader; the grader sticks to what's visible on the chart, the EMA pullback, the round numbers, and the tick volume.
Why does it matter that New Zealand opens the trading day so early?
Wellington is among the first major financial centers to open anywhere in the world each trading day, ahead of Sydney and hours ahead of Tokyo, so a NZD/JPY move can already be underway before most other desks are watching. Because New Zealand is also one of the smaller economies behind a G10 currency, the order books behind the kiwi dollar tend to be thinner than a bigger cross like EUR/JPY or AUD/JPY carries, so a light headline or a quiet data print in the early hours can travel further than the same order would move on a more liquid pair. A pullback that formed in that early, thinner window can look identical on the chart to one built once Tokyo liquidity arrives, and the grader scores the structure the same way regardless of which session it happened in.
Are the entry, stop, and targets in pips?
Yes. NZD/JPY is a yen pair quoted to two or three decimals where a pip works out to 0.01, and the entry, structural stop, and targets come back in that format alongside the underlying prices, with the reward measured against the risk after spread. Given how much further a thin-book move can travel on this cross, it is worth checking the stop distance the grader returns against your own account risk before sizing the trade.
Can it grade a NZD/JPY short setup?
Yes. Set your trading style to Short Only and SnapPChart runs a dedicated short-side read on the chart: order flow, structure, and volume that would support a bearish continuation or reversal. If the chart doesn't actually support a short, the grader says so honestly, scoring it down rather than inventing a bearish setup that isn't there. It still only reads the screenshot you upload; there's no live short-interest, borrow-rate, or margin-availability data behind the call. See the dedicated short-setup grader at /short-trade-analyzer for more on how that works.
Is NZD/JPY chart analysis free to try?
Yes. New accounts get one free grade. You see the setup's grade and the general read on your chart. Entry, stop, targets and the trade plan come with a paid plan. No card needed to try it. Upload an NZD/JPY chart to see how it reads the setup.
Grade your next NZD/JPY setup before you enter.
Drop your NZD/JPY screenshot in from the homepage and get a structured setup read back in seconds. No credit card required.
Grade a NZD/JPY Chart Free