Grade your NZD/CAD setup on a cross between two different commodity currencies.
New Zealand and Canada both float a currency that leans on what the country ships abroad, but they sell the world completely different things. New Zealand's biggest export is dairy, priced largely off Fonterra's regular Global Dairy Trade auctions, sold heavily into a market where China is the top buyer. Canada's export story runs through crude oil, priced against WTI, sold mostly to the United States next door. SnapPChart takes a NZD/CAD screenshot and checks the structure against the 9 and 20 EMA, tests the round-number level in play, and weighs that against the tick volume printed on the candles, before handing back a setup grade, an entry, a stop, and staged exit levels with the reward measured against the risk.
Drag and drop your chart screenshot
or click to browse. PNG, JPG, or WebP.
Your first grade is free, no card: it shows the setup's grade and the general read. Entry, stop, targets and the trade plan come with a paid plan.
Make sure both the time axis (X) and price axis (Y) are visible in your screenshot for accurate results.
Grade
B+
Entry
$3.87
Stop
$3.75
Target
$4.24
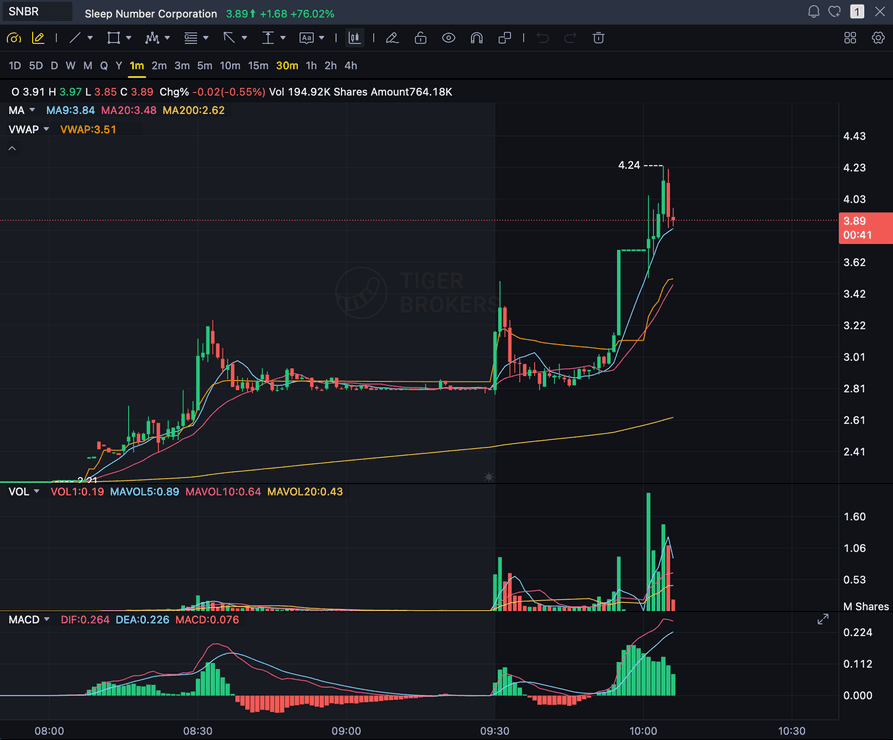
Format example (stock chart)
SNBR 1m bull flag pullback: strong opening momentum, lighter-volume consolidation, and a late breakout attempt near 3.89. Forex, crypto and futures screenshots get the same structure: a grade, entry, structural stop and targets.
NZD/CAD
Two commodity currencies tied to two different commodities
DAIRY VS OIL
NZD tracks Fonterra dairy auctions, CAD tracks crude oil
EMA
Pullback into the 9 and 20 EMA on a clean trend
RBNZ / BOC
A rate-differential and commodity-divergence trade
Quick answer
How do you analyze a NZD/CAD chart with AI?
Send SnapPChart a screenshot of your NZD/CAD chart and it comes back within seconds with an A+ through F grade, an entry, a stop drawn from the chart's own structure, staged exit targets, and the reward measured against the risk. Both currencies here get filed under 'commodity currency,' but they are not exposed to the same commodity. The New Zealand dollar moves with dairy, the country's largest export earner, and a Fonterra Global Dairy Trade auction result can move it the same day; China buys more of New Zealand's exports than any other country does. The Canadian dollar moves with crude oil, since Canada exports a large volume of it and ships most of that abroad to the United States, its dominant trading partner. That makes NZD/CAD less a single commodity trade than a divergence trade: whichever of dairy or oil is stronger that stretch, layered on top of whatever gap has opened between Reserve Bank of New Zealand and Bank of Canada policy rates, tends to decide which way the pair leans. That central-bank and commodity backdrop never reaches the grader. What it actually judges is the pullback shape against the 9 and 20 EMA, whether the round number held, and whether tick volume backs the move, holding every NZD/CAD chart to that same standard however the dairy-versus-oil story is running that week. Live NZD/CAD prices, dairy auction results, oil prices, and the RBNZ or Bank of Canada policy calendar all sit outside what it reads.
What the AI Returns From a Screenshot
Use the output as a repeatable pre-trade checkpoint, not a prediction.
A+ to F Setup Grade
See whether the setup has enough pattern clarity, momentum, volume, and reward to justify the risk.
Entry, Stop, Targets
Get a structured trade plan with entry zone, invalidation level, targets, and risk/reward.
Screenshot-Based Read
Use charts from TradingView, Webull, ThinkOrSwim, MetaTrader, Robinhood, or any broker.
Risk Notes First
The analysis flags extension, messy chop, weak retests, thin reward, and conflicting indicators.
Workflow
Use it as a pre-entry gate on every NZD/CAD setup
A NZD/CAD chart can look the same whether dairy prices are doing the pushing, oil is doing the pulling, or the RBNZ and Bank of Canada are simply drifting apart on rates, and the structure needed to trust a pullback doesn't change based on which one it is. Check every NZD/CAD setup against the same standard before you commit to it.
- Check a NZD/CAD pullback against the 9 and 20 EMA before entering
- Confirm the round-number level the kiwi-loonie cross is actually holding
- Look for tick volume that actually confirms the move, not just rides along with it
- Keep the structural read separate from whatever the dairy or oil headline says that day
- Review the bear case and invalidation before sizing the position
- Walk away from a C-grade NZD/CAD setup when the reward doesn't clear the risk
Head to head
SnapPChart vs a general AI chat assistant for NZD/CAD
NZD/CAD sets dairy against oil, two commodity currencies with different customers, so a move can come from either side or from the RBNZ and Bank of Canada drifting apart. A general AI tool tends to explain the macro. SnapPChart grades whether the kiwi-loonie chart is worth trading.
| Feature | SnapPChart | General AI chat assistant |
|---|---|---|
| Grades the chart whether dairy or oil is pushing | One fixed rubric | Explains, then hedges |
| Pip stop on a thinner cross than USD/CAD | Structural stop | Varies by prompt |
| Tick volume that confirms the kiwi-loonie move | Every read | Rarely weighed |
| Round number the kiwi-loonie cross is holding | When visible on chart | Inconsistent |
| Explains Fonterra auctions and the WTI link | Not graded | Yes, at length |
| Long and short NZD/CAD setups graded | Both directions | Prompt-led |
| A clear take, wait, or skip call | Every paid grade | Rarely commits |
Keep Learning the Setup
Use these guides to understand how SnapPChart grades the trade instead of taking the output blindly.
What do traders ask about NZD/CAD Chart Analysis?
How SnapPChart grades a NZD/CAD chart from a screenshot.
How do I analyze a NZD/CAD chart with AI?
Take a screenshot of your NZD/CAD chart from whatever platform you use and upload it to SnapPChart. There's nothing to type in and no account or data feed to connect. A multimodal vision model reads the picture itself: the pullback into the 9 and 20 EMA, the round-number reaction, and the tick volume printed on the candles, then hands back a grade, an entry, a stop, staged targets, and the risk-reward math.
Does it read live NZD/CAD prices, dairy auction results, oil prices, or the RBNZ and Bank of Canada calendar?
No. The grader only sees what's in the screenshot you give it. It doesn't pull live NZD/CAD quotes, Fonterra's Global Dairy Trade results, WTI crude prices, or the Reserve Bank of New Zealand and Bank of Canada policy calendars, and it doesn't check any other currency pair. The commodity story behind each side of this pair is useful for you to know as a trader; the grader itself sticks to the pullback shape, the round numbers, and the tick volume it can actually see on the chart.
Why does NZD/CAD pair two commodity currencies instead of one against a haven or a major?
Most crosses on this site pair a commodity-linked currency against something else entirely: a safe haven like the Swiss franc or yen, a diversified financial-hub currency like sterling, or a reserve currency like the euro. NZD/CAD is built differently. Both sides here are commodity currencies, just tied to different commodities and different end markets. New Zealand's economy leans on dairy and other agricultural exports sold heavily into China, while Canada's leans on crude oil sold mostly to the United States. When dairy prices and oil prices move together, the pair can sit relatively flat; when they pull apart, or when the Reserve Bank of New Zealand and Bank of Canada start moving policy rates in different directions, that gap tends to show up directly on the NZD/CAD chart. The grader doesn't weigh either commodity or either central bank. It reads the structure that results, the EMA pullback, the round-number reaction, and the tick volume, and scores it the same way no matter which side is driving that week's move.
Are the entry, stop, and targets in pips?
Yes. NZD/CAD prices out to four or five decimal places like most non-yen pairs, so a pip works out to 0.0001, and the grader returns the entry, the stop, and every staged target in that unit alongside the underlying price, with the reward-to-risk figured in pips too. This cross trades thinner than a EUR/USD or USD/CAD, so double-check that the stop distance holds up against your own account risk before you commit size.
Can it grade a NZD/CAD short setup?
Yes. Switch your trading style to Short Only and SnapPChart works through a dedicated short-side read on the NZD/CAD chart: the order flow, the structure, and the volume that would need to be there for a bearish continuation or reversal to hold up. A chart that doesn't genuinely support a short gets marked down honestly instead of getting a bearish setup invented for it. The read still comes only from the screenshot you upload, with no live short-interest, borrow-rate, or margin-availability data feeding into it. The dedicated short-setup grader at /short-trade-analyzer goes deeper into how that works.
Is the New Zealand dollar really tied to dairy, and the Canadian dollar really tied to oil?
Both links are real and well documented, and neither is absolute. Dairy is New Zealand's single largest export earner, and Fonterra's regular Global Dairy Trade auctions are watched closely enough that a surprise result can move the currency the same day; China's position as New Zealand's top export market adds a second layer, since a slowdown in Chinese demand can weigh on the same trade. Canada, for its part, ships a large volume of crude oil, mostly to the United States, so a sustained move in oil prices tends to show up in the Canadian dollar over time. Neither relationship holds in every single session, and other factors, interest rates, broader risk appetite, domestic data, matter too. That's useful background for you to weigh as a trader; the grader doesn't factor either commodity into the score, only the structure visible on the chart.
Is NZD/CAD chart analysis free to try?
It is. New accounts get one free grade. You see the setup's grade and the general read on your chart. Entry, stop, targets and the trade plan come with a paid plan. No card needed to try it. Upload an NZD/CAD chart to see how it reads the setup.
Grade your next NZD/CAD setup before you enter.
Send in your kiwi-loonie screenshot from the homepage and get back a graded setup, entry, stop, and targets included, in seconds. Your first grade is free, no card: it shows the setup's grade and the general read.
Grade a NZD/CAD Chart Free