Stock trading AI that grades the setup before you size in.
Stock trading AI for the moment before you click buy. Upload the equity chart you are about to trade and get a grade on structure, relative volume, EMA and VWAP context, entry, stop, targets, and the case against the trade.
Drag and drop your chart screenshot
or click to browse. PNG, JPG, or WebP.
Your first grade is free, no card: it shows the setup's grade and the general read. Entry, stop, targets and the trade plan come with a paid plan.
Make sure both the time axis (X) and price axis (Y) are visible in your screenshot for accurate results.
Grade
B+
Entry
$3.87
Stop
$3.75
Target
$4.24
Format example (stock chart)
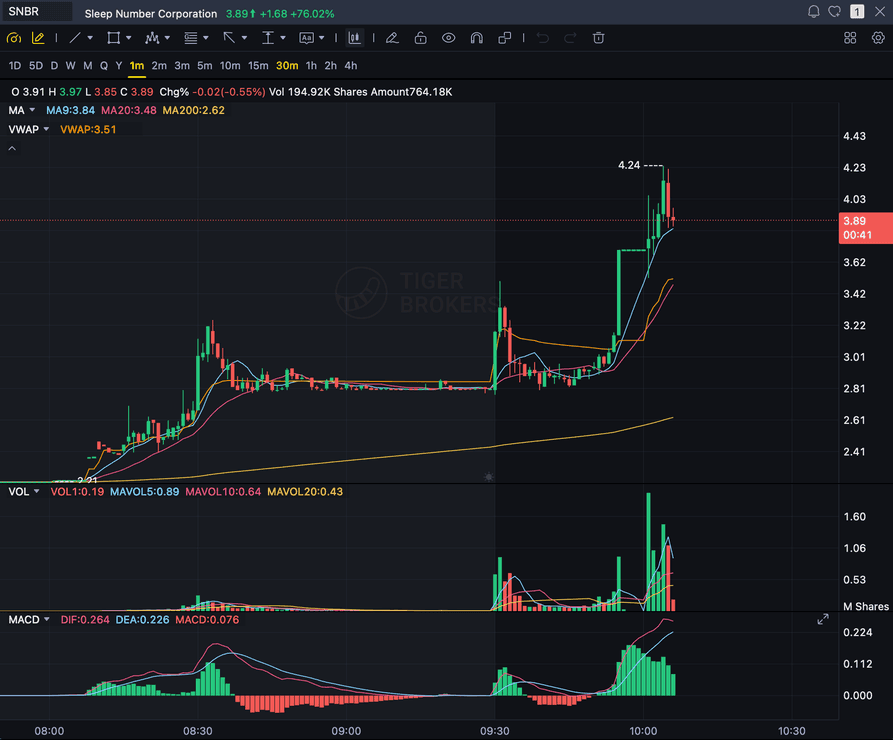
SNBR 1m bull flag pullback: strong opening momentum, lighter-volume consolidation, and a late breakout attempt near 3.89. Forex, crypto and futures screenshots get the same structure: a grade, entry, structural stop and targets.
RVOL
Is anyone actually behind this move?
EMA
Trend context on the timeframe you trade
VWAP
Intraday value, reclaim, and rejection
STRUCTURE
Higher lows, base quality, and the last swing
Quick answer
What is stock trading AI?
Stock trading AI means using a chart-reading model to grade an equity setup before you take it. You upload the screenshot, and the AI reads structure, moving averages, VWAP, and relative volume, then returns a setup grade, entry zone, structural stop, and targets.
The part that matters for stocks specifically is participation. A pattern that looks identical on two tickers is not the same trade if one is moving on triple its usual volume and the other is drifting on nothing, and volume is the field most traders skip when they eyeball a chart. SnapPChart reads the volume bars you upload alongside the price structure, so the grade reflects whether anyone is actually behind the move. It also names the bear case explicitly, which is where an extended stock gets caught before you size into it rather than after.
What the AI Returns From a Screenshot
Use the output as a repeatable pre-trade checkpoint, not a prediction.
A-F Setup Grade
See whether the setup has enough pattern clarity, momentum, volume, and reward to justify the risk.
Entry, Stop, Targets
Get a structured trade plan with entry zone, invalidation level, targets, and risk/reward.
Screenshot-Based Read
Use charts from TradingView, Webull, ThinkOrSwim, MetaTrader, Robinhood, or any broker.
Risk Notes First
The analysis flags extension, messy chop, weak retests, thin reward, and conflicting indicators.
Workflow
Where a stock grade actually changes the decision
Most bad equity trades are not bad patterns. They are decent patterns taken too late, too big, or without checking who else showed up.
- Grade a pre-market gapper before the open instead of chasing the first candle
- Check whether relative volume supports a breakout above the prior day's high
- Read EMA and VWAP context before adding to a position that is already running
- Re-grade the same ticker after a pullback to see whether the setup improved
- Compare two candidates on one scale instead of trusting whichever chart you saw first
- Skip the C-grade continuation where the stop has to sit under half the day's range
Market pulse
What's moving equities today
Recent headlines on the tickers SnapPChart traders are uploading. A grade reads the chart, not the story behind it, so check why a stock is moving before you size in.
Skydance Rebounds 5% as Warrant Adjustment Selloff Fades; Netflix Rises 3%, Disney Advances 2%
A warrant adjustment sent Skydance shares into freefall, but buyers are already stepping back in while Netflix and Disney post quieter gains. What the split between the common stock and…
Opendoor and Zillow Surge 7% as Long-Term Rates Retreat; Compass Climbs 6%
Falling Treasury yields are sending housing stocks sharply higher, but one company stands apart because rate moves hit its balance sheet and its inventory at the same time. Whether that…
Quantum Computing Stocks Rebound After Dilution Scare: IonQ and Rigetti Climb 3%, D-Wave Advances 2%
A dilution scare sent quantum computing stocks into a tailspin, but IonQ, Rigetti, and D-Wave are clawing back gains while a key ETF moves in the opposite direction, raising questions…
Netflix's KPop Demon Hunters Is Coming to Toca Boca World™ This October
Spin Master's digital studio Toca Boca® is bringing Netflix's most popular film, KPop Demon Hunters, into the Toca Boca World app, giving its close to 60 million players access to…
Bitcoin rebounds from near $80,000 as Kospi plunges 8%, with altcoins falling harder
Bitcoin rebounds from near $80,000 as Kospi plunges 8%, with altcoins falling harder CoinDesk
Bitcoin Price Teeters Near $80K as Global Stock Rout Rattles Markets
Bitcoin Price Teeters Near $80K as Global Stock Rout Rattles Markets Cryptonews.net
Head to head
SnapPChart vs a general AI chat assistant for stock setups
A general AI chat tool will happily narrate a stock chart, but the read changes every time you ask and it rarely commits to a stop. SnapPChart returns the same structured fields on every equity chart, so a Tuesday gapper and a Friday pullback are graded to one standard.
| Feature | SnapPChart | General AI chat assistant |
|---|---|---|
| Grades stock chart screenshots | Yes, every upload | Inconsistent |
| Relative volume factored into the grade | When volume bars are visible | Varies by prompt |
| Flags an extended stock before you chase | Every bear case | Rarely flagged |
| Same grading scale across tickers | A-F, every time | No fixed scale |
| Places trades for you | No, by design | No |
Keep Learning the Setup
Use these guides to understand how SnapPChart grades the trade instead of taking the output blindly.
What traders ask about stock trading AI
How SnapPChart reads equity charts, and what it will not do.
What should a stock chart screenshot include?
Include the ticker, the timeframe, the price scale, 40 or more recent candles, volume bars, and whichever moving averages you actually trade off. Cropping the price scale is the most common mistake: without it the model estimates levels instead of measuring them, and the stop and targets come back vaguer than they should.
Does stock trading AI pick stocks for me?
No, and that is deliberate. SnapPChart does not scan the market, screen for candidates, or send alerts. You find the stock; it grades the chart you bring. That boundary is the product: a grader you can check your own idea against is a different tool from a signal service that tells you what to buy.
Can it read after-hours and pre-market charts?
Yes. It reads whatever is in the screenshot, including extended-hours sessions. Bear in mind that pre-market volume is thin by nature, so a breakout on light extended-hours participation is graded more cautiously than the same shape during regular hours.
Does it handle earnings gaps?
It grades the chart in front of it, including the gap and how price has behaved since. What it cannot do is know the earnings result, guidance, or why the gap happened. Treat the grade as a read on structure and participation, not on the news behind the move.
Does it work for small-cap and low-float stocks?
Yes. Low-float momentum names are part of the trader profile SnapPChart was built around, and relative volume carries more weight there than almost anywhere else. There is a dedicated small-cap page if that is most of what you trade.
Can I grade short setups?
SnapPChart is optimised for long momentum continuation setups. Shorts, options, and hedging are out of scope by design. Grading one strategy well is more useful than grading five badly.
Is stock trading AI accurate?
A grade is an assessment of setup quality, not a prediction. An A-grade setup can lose and a C-grade setup can run. What the grade gives you is consistency: the same standard applied to every chart, so you can look back over a month of trades and see whether your losses cluster in the setups you were already told were weak.
Is there a free way to try it?
Yes. New accounts get one free grade. You see the setup's grade and the general read on your chart. Entry, stop, targets and the trade plan come with a paid plan. No card needed to try it. Upload a chart you are watching to see how it grades.
Grade the stock before you size in.
Upload the equity chart from the homepage and get a structured read on the setup.
Grade a Stock Chart Free