Grade the EMA rejection before you short the bounce.
Upload a chart where price is trending under a falling 9 and 20 EMA and pops back up into one of them, and get a read on whether the EMA held as resistance, how the candle at the line closed, which rally of the move this is, what volume did on the way up and on the way back down, and a short trade plan when the setup earns one.
Drag and drop your chart screenshot
or click to browse. PNG, JPG, or WebP.
Your first analysis is free. No credit card.
Make sure both the time axis (X) and price axis (Y) are visible in your screenshot for accurate results.
Grade
B+
Entry
$3.87
Stop
$3.75
Target
$4.24
Format example (stock chart)
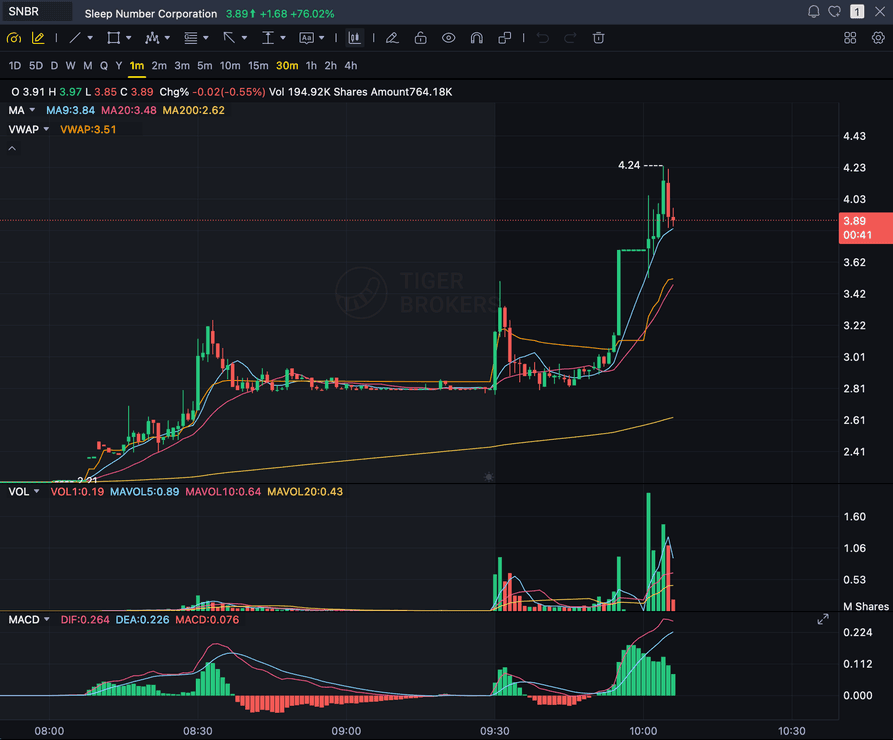
SNBR 1m bull flag pullback: strong opening momentum, lighter-volume consolidation, and a late breakout attempt near 3.89. Forex, crypto and futures screenshots get the same structure: a grade, entry, structural stop and targets.
9 EMA
The fast line that caps shallow one to three candle pops
20 EMA
Where deeper rallies in the downtrend tend to stall
REJECTION
An upper wick and a close back under the line
VOLUME
Quiet on the pop, heavier once sellers come back
Quick answer
What is an EMA rejection, and can AI grade it?
An EMA rejection is a with-trend short. In a downtrend with price under a falling 9 and 20 EMA, price pops one to three small candles back up into one of them, stalls with the EMA acting as resistance, and closes back down. Traders short the break of the rejection candle's low. SnapPChart grades that setup from your screenshot.
Think of it as the EMA pullback flipped upside down, and every piece of it shows on one chart. Trend first: lower highs and lower lows, the 9 EMA under the 20 EMA, both pointing down. If the two lines are flat and braided together there is no trend to join, and rejections in chop are mostly noise. Then the pop: a few small green candles on light volume. The 9 EMA tends to cap shallow pops in a fast trend, the 20 EMA the deeper ones. Then the rejection itself: a wick into or just through the line and a close back under it, often a shooting star, a long upper wick, or a red engulfing candle, ideally with selling volume picking up. A touch is not the signal; the close is. The usual trigger is the break of that candle's low, with the stop above the rejection high or the last swing high rather than a few cents over the EMA, a first target at the prior swing low or low of day, and the stop on the rest trailed down with the 9 EMA. What kills it is a candle that closes back above the EMA and holds there. SnapPChart reads the whole sequence from the image you upload: the EMA lines you plotted and how price behaved around them, the swing structure, the candle at the line, volume on both legs, VWAP if it is on the chart, and whether this is the first, second, or third pop of the move. You get a grade and one of three calls (take it now, wait for a better price, or skip), plus a short entry, a stop above resistance, and downside targets when the plan clears roughly 2:1. It only sees what is on the screenshot. It cannot tell which period a line is unless your legend labels it, cannot see the higher timeframe or earlier price that is off the screen, and does not read news or live data. It does not plot the EMAs, scan for rejections, send alerts, or predict the next candle. Individual stocks are graded on the full A+ to F scale; futures, forex, crypto, index, and metals charts are capped at B.
What the AI Returns From a Screenshot
Use the output as a repeatable pre-trade checkpoint, not a prediction.
A-F Setup Grade
See whether the setup has enough pattern clarity, momentum, volume, and reward to justify the risk.
Entry, Stop, Targets
Get a structured trade plan with entry zone, invalidation level, targets, and risk/reward.
Screenshot-Based Read
Use charts from TradingView, Webull, ThinkOrSwim, MetaTrader, Robinhood, or any broker.
Risk Notes First
The analysis flags extension, messy chop, weak retests, thin reward, and conflicting indicators.
Workflow
Run it before the short, not after the stop-out
Most pops into a falling EMA look like rejections right up until one closes above the line and keeps going. SnapPChart applies the same short-side checklist every time, so you are not the one grading your own trade at the exact moment you most want to take it.
- Plot the 9 and 20 EMA with their periods showing in the legend, and keep volume visible
- Let the candle at the EMA close before you screenshot; a wick mid-bar can still turn into a reclaim
- Confirm the downtrend: lower highs, lower lows, 9 under 20, both pointing down
- Count the pops into the EMA: the first or second grades better than the third
- Look for the close back under the line and selling volume on that candle
- Pass when the read shows a close back above the EMA, flat EMAs, or buyers stepping in
Head to head
SnapPChart vs a general AI chat assistant for EMA rejection shorts
Ask a general AI tool about a rally into the 20 EMA and you will mostly get a description of the line. What you will not reliably get is the same short-side checks on every chart: is the trend actually down, which rally is this, did the candle close back under the EMA, and did sellers show up on volume. SnapPChart runs that checklist on every screenshot you upload, so a clean rejection and a pop that is about to reclaim the EMA come back with different grades.
| Feature | SnapPChart | General AI chat assistant |
|---|---|---|
| Grades the EMA rejection short from your screenshot | Yes, every upload | Inconsistent |
| Checks lower highs, lower lows, and a falling 9 and 20 EMA before anything else | Every grade | Rarely |
| Tells a close back under the EMA apart from a wick through it | From the image | Varies by prompt |
| Scores the first or second rally above a tired third one | Built into the grade | Rarely |
| Weighs volume on the pop against volume on the rejection | Every grade | Rarely |
| Explains why the stop sits above that resistance | Every plan | Prompting required |
| Drops a short whose first target pays less than about 2:1 | Checked on every plan | Up to you |
Learn the EMA rejection setup
The long-side mirror, the VWAP version of the same short, and the guides behind the 9 and 20 EMA, so you know why a rejection grades the way it does instead of trusting the letter blindly.
What do traders ask about EMA Rejection AI?
How SnapPChart grades a 9 or 20 EMA rejection short from your screenshot.
How does the AI grade an EMA rejection?
It reads the EMA lines drawn on your chart and checks the downtrend first: lower highs, lower lows, and price under a falling 9 and 20 EMA. Then it looks at the pop into the line and the candle that met it. A long upper wick, a shooting star, or a red engulfing candle closing back under the EMA counts toward the short; a hammer, a green engulfing candle, or a close above the line counts against it. Volume on the pop versus volume on the rejection, and whether this is the first, second, or third rally of the move, go into the same grade. You get the grade, a take, wait, or skip call, and a short plan when the numbers work.
Should I use the 9 EMA or the 20 EMA?
Most day traders watch both on the 1 or 5 minute chart. In a fast trend the pops are shallow and the 9 EMA caps them; when a rally runs deeper, the 20 EMA is usually where it stalls. Swing traders run the same idea on the 4 hour or daily chart, often with the 20, 50, or 200 EMA. SnapPChart treats whichever line price is pressing into as the resistance, but it cannot work out a line's period from the picture. If your legend shows EMA 9 and EMA 20, the read can name them; if it does not, any period the read names is an assumption, so label them.
Is an EMA rejection the same as a 9 and 20 EMA crossover?
No. A crossover, the 9 EMA crossing under the 20, is a trend signal, and by the time it prints a good part of the move is often gone. The rejection is the entry inside a trend that has already crossed: the 9 sits under the 20, price pops back into them, and fails. SnapPChart reads the 9 under 20 stack as trend context and does not fire a signal when two lines cross. If price has already dropped well away from the EMA without popping back into it, the grader flags that as chasing and leans toward wait.
Where do the entry, stop, and targets go?
The usual playbook is to short the break of the rejection candle's low, so the market confirms the failure before you are in. The stop goes above the rejection candle's high or the last swing high, beyond the structure rather than a few cents over the EMA line, since wicks poke through EMAs all the time. First target is the prior swing low or the low of day; many traders cover part there and trail the stop down with the 9 EMA. SnapPChart works out its own levels from what the chart shows. If the call is take it now, the entry sits near the current price; if price has already slid away from the EMA, the call is usually wait, with a conditional entry back up at a resistance level it read. A plan whose first target pays less than about twice the risk (2.5 times on forex) is dropped and the call becomes skip.
Is an EMA rejection a reversal trade?
No. It is a continuation short inside a downtrend that already exists. The grader will not call a short on a chart in an established uptrend, even when the last few candles are red, so the first dip under the 20 EMA after a long run up is not this setup. A range with flat EMAs is not either: with no downtrend to continue, the grader will not call it a short.
What makes an EMA rejection fail?
The classic failure is a candle that closes back above the EMA and holds, especially on rising buying volume, which turns the rejection into a reclaim. Other warning signs the grade picks up: a third pop into the line after two earlier ones (that alone keeps it out of the A+ tier), a rally that has already retraced more than half of the prior drop, or a short taken far under the 9 EMA after the move is gone. Each one pulls the grade down. A very large green volume bar anywhere on the chart goes further and can count as a no-go, which grades F.
Does VWAP matter on an EMA rejection?
On stock charts, yes. Price trading above VWAP is one of the grader's no-go conditions for a short, so a clean-looking 9 EMA rejection that happens above VWAP can still grade F. The strongest stock versions happen with price under both the EMAs and VWAP. That VWAP rule applies to stock charts only. If VWAP is not on your chart, the read notes it as not visible and works from the EMAs on their own.
Can it check the higher timeframe or read live price?
No. It grades the one screenshot you upload. If the daily trend matters to your short, and it usually does, upload the daily chart as its own analysis and compare the two reads. It does not stream price, watch the tape, read news, or know what happened before the left edge of the image, and it does not scan the market or alert you when a rejection forms. You find the setup and take the screenshot; it grades what is in it.
Is there a free trial for EMA rejection grading?
Yes. Every new account gets two free chart analyses, no card needed. The first comes back complete, plan included when the setup earns one, so you can see exactly what an EMA rejection grade gives you. The second shows the grade and the levels it read, with the entry, stop, and targets locked.
Grade the rejection candle before you sell the pop.
Label your 9 and 20 EMA, wait for the candle at the line to close, then drop the screenshot on the homepage uploader and see how the short grades.
Grade an EMA Rejection Free