Grade the red to green move after the reclaim holds.
Upload an intraday chart with the prior day's close drawn as a line, after the stock has crossed back above it, and get a read on whether the reclaim is holding, the higher low above the level, VWAP and EMA context, and the volume behind the push, so a held reclaim and a reclaim that is already slipping back under the line get scored differently.
Drag and drop your chart screenshot
or click to browse. PNG, JPG, or WebP.
Your first analysis is free. No credit card.
Make sure both the time axis (X) and price axis (Y) are visible in your screenshot for accurate results.
Grade
B+
Entry
$3.87
Stop
$3.75
Target
$4.24
Format example (stock chart)
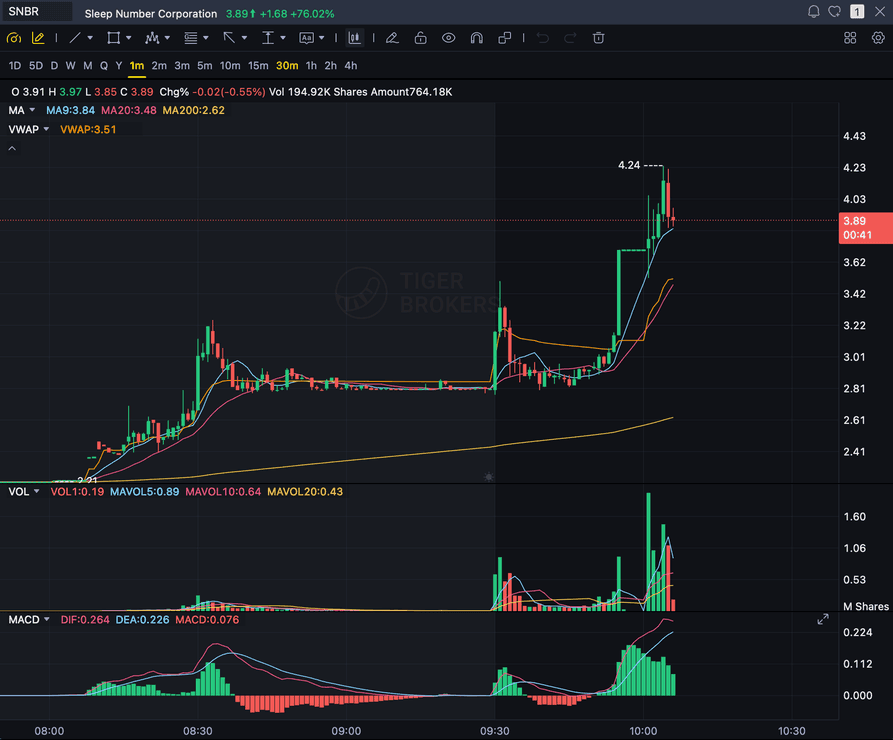
SNBR 1m bull flag pullback: strong opening momentum, lighter-volume consolidation, and a late breakout attempt near 3.89. Forex, crypto and futures screenshots get the same structure: a grade, entry, structural stop and targets.
PRIOR CLOSE
The red to green line, as you drew it on the chart
HIGHER LOW
The hold above the level that makes it gradeable
VWAP
Ideally below price once the reclaim holds
VOLUME
Participation on the push through the prior close
Quick answer
What is a red to green move, and can AI grade it?
A red to green move is when a stock opens below the prior day's close, trading red on the day, then climbs back through that close and turns green. The long worth grading comes after the cross: price holds above the prior close and prints a higher low there, ideally above VWAP as well. Until that hold shows up, there is no setup to grade yet.
Most write-ups agree on the same pieces. The level is the prior day's closing price, which is why traders draw a horizontal line there before the open. The first sign is a candle closing above that line, with volume picking up on the push through it rather than fading. The better entries come once the reclaim has held: a shallow pullback that stays above the prior close and turns up again, or a retest of the line from above that holds as support. The stop goes below that higher low or back under the prior close, and the idea is wrong if the stock goes red again and stays there. SnapPChart grades the setup from the screenshot you upload. It has no prior-close field and does not look the number up, so it reads that level only if you plotted it on the chart as a horizontal line or a label. With the line visible, it reads the candles around it, the higher low, VWAP, the 9 and 20 EMA, MACD, and volume, then returns a setup grade and a take, wait, or skip call. When the setup qualifies, it adds an entry, a structural stop, and targets; a skip names what is missing, such as no hold above the line yet or thin volume on the cross. Grade it after the cross holds, not before: ahead of the cross the line is still overhead resistance on the chart, and the long has nothing to stand on. It reads the image only. It does not stream quotes, scan for gap-down stocks, send alerts, or quote win rates. Individual stocks are graded on the full A+ to F scale; futures, forex, crypto, index, and metals charts are capped at B. SnapPChart grades momentum continuations, long or short, so the grade is about the long after the reclaim, not about calling the low of the morning selloff.
What the AI Returns From a Screenshot
Use the output as a repeatable pre-trade checkpoint, not a prediction.
A-F Setup Grade
See whether the setup has enough pattern clarity, momentum, volume, and reward to justify the risk.
Entry, Stop, Targets
Get a structured trade plan with entry zone, invalidation level, targets, and risk/reward.
Screenshot-Based Read
Use charts from TradingView, Webull, ThinkOrSwim, MetaTrader, Robinhood, or any broker.
Risk Notes First
The analysis flags extension, messy chop, weak retests, thin reward, and conflicting indicators.
Workflow
Use it as a quality check once the stock turns green
Plenty of gap-down stocks poke above the prior close and slip straight back under it. SnapPChart gives you a consistent read on whether this reclaim actually held before you take the long.
- Draw a horizontal line or label at the prior day's close before the session starts
- Plot VWAP and the 9 and 20 EMA, with volume visible, on a 1 or 5 minute chart
- Wait for a candle to close above the prior close instead of grading the climb toward it
- Screenshot once a higher low has printed above the line, or a retest of it has held
- Check that volume picked up on the cross and that price is above VWAP
- Skip it when the grade flags a close back under the prior close or a thin push through it
Head to head
SnapPChart vs a general AI chat assistant for red to green setups
A general AI tool can tell you a stock is back above yesterday's close, but it will not check the hold, the higher low, VWAP, and the volume behind the cross to the same standard every time. SnapPChart runs the same long checklist on every chart you upload, so a reclaim that has held and a reclaim that is already slipping back under the line are not scored alike.
| Feature | SnapPChart | General AI chat assistant |
|---|---|---|
| Grades the red to green setup on your screenshot | Yes, every upload | Inconsistent |
| Reads the prior close line you drew on the chart | From the image | Varies by prompt |
| Grades the pullback and hold above support, not a chase into the level | Long checklist | Rarely |
| Checks volume behind the push through the prior close | Every grade | Rarely |
| Reads VWAP and 9 / 20 EMA context around the reclaim | From the image | Varies by prompt |
| Names the risk of a close back under the prior close | Every bear case | Rarely flagged |
| Entry, stop below the higher low, and targets | When the setup qualifies | Prompting required |
| Same criteria on every gap-down reclaim | Fixed methodology | Varies by session |
Learn the red to green setup
Use these sibling setups and guides to see what makes a reclaim grade well, so you take the read instead of the output blindly.
What do traders ask about Red to Green AI?
How SnapPChart grades a red to green setup from your screenshot.
How does the AI grade a red to green setup?
It reads the prior close line you drew, the candles that crossed it, and whether price has held above it with a higher low. It factors VWAP, the 9 and 20 EMA, MACD, and the volume behind the push into the grade, then returns a setup grade and a take, wait, or skip call. When the setup qualifies, it adds an entry, a stop below the higher low, and targets. A skip names what is missing.
Does SnapPChart know the prior day's close?
No. It has no prior-close field, does not look the number up, and does not read live quotes. It reads the level only if it is on the screenshot, so draw a horizontal line at the prior day's close, or add a label, before you upload. Without the line, the chart gives it no way to tell which price is the red to green level.
Should I grade it before or after the stock crosses the prior close?
After, once the reclaim has held. A stock trading back up toward the prior close is not yet the setup, because the line is still overhead resistance. The long becomes gradeable when a candle has closed above the prior close and a higher low has printed above it, ideally with price above VWAP too. Grading ahead of the cross asks the AI to judge a trade that has not formed.
Where do the entry, stop, and targets go?
Common practice is to enter as the higher low above the prior close turns up, or on a retest of the line from above that holds. The stop goes below that higher low or back under the prior close; some traders use VWAP or the morning low instead. Targets are usually the prior day's high or the next resistance visible on the chart. SnapPChart returns its own levels from what the chart shows, and flags when the reward to the first target is too small for the risk.
How is red to green different from a VWAP reclaim or a gap-and-go?
A VWAP reclaim keys off the intraday VWAP line; red to green keys off the prior day's close. The two often line up, and a reclaim that holds above both is the cleaner picture. A gap-and-go starts with a gap up that holds and continues; red to green starts with a gap down that the stock climbs back out of. The short-side mirror, green to red, is a different setup and is not what this page grades.
What makes a red to green move fail?
The usual failure is a close back under the prior close that holds, which turns the day red again and leaves the long without its level. Other warning signs are a thin-volume push through the line, tight chop sitting right on it, and price still under VWAP with the 9 and 20 EMA pointing down. The grade drops on these and the case against the trade calls them out.
Is there a free trial for red to green grading?
Yes. New users get two lifetime chart analyses. The first shows the full output so you can see exactly what the red to green grade returns; the second is gated to show what the paid product adds. No credit card required.
Grade the red to green move once it holds.
Draw the prior day's close, screenshot the chart after the reclaim has held, and upload it from the homepage for a structured read on the long.
Grade a Red to Green Setup Free