Grade your USD/BRL setup on the one EM cross priced like a G7 pair.
Every other emerging-market dollar cross SnapPChart covers prices to 2 decimals and respects whole-currency levels: USD/MXN watches 17.00, USD/ZAR watches 16.00. USD/BRL breaks that pattern. Brazil's real has floated freely since 1999, but the pair itself is quoted to 4 decimal places, the same convention as EUR/USD, so a screenshot of it calls for a different read, big figures like 5.00, 5.10, 5.20, and 5.50 instead of whole-real marks. SnapPChart works off what's actually in that screenshot: how far price has pulled back toward the 9 and 20 EMA, whether one of those big figures is genuinely holding, and whether the tick volume backs the move, then hands back a setup grade, an entry, a stop, and staged targets priced against the risk.
Drag and drop your chart screenshot
or click to browse. PNG, JPG, or WebP.
Your first analysis is free. No credit card.
Make sure both the time axis (X) and price axis (Y) are visible in your screenshot for accurate results.
Grade
B+
Entry
$3.87
Stop
$3.75
Target
$4.24
Sample readout
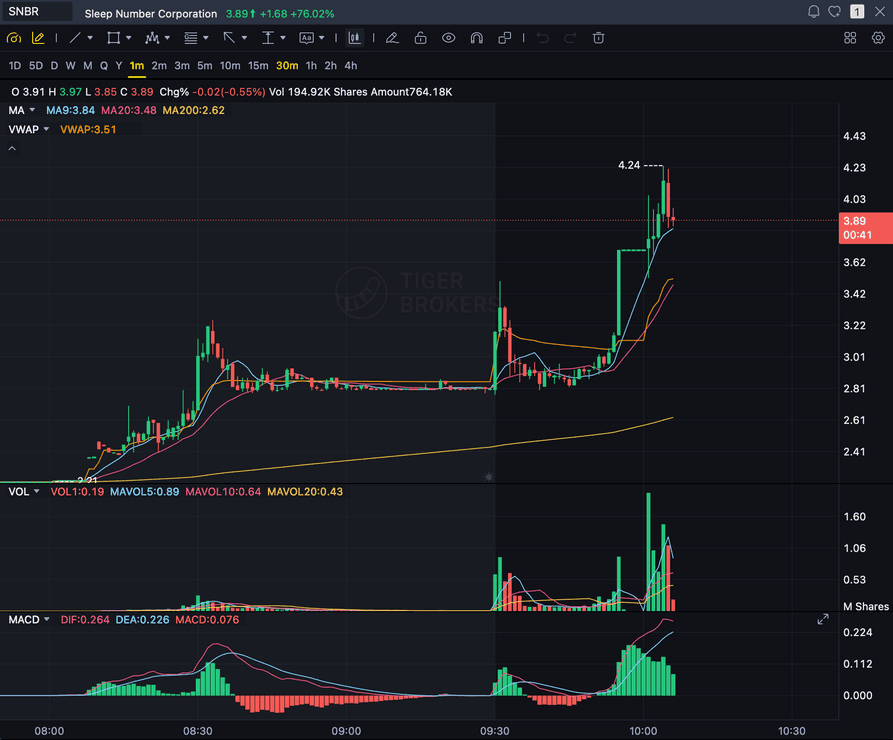
SNBR 1m bull flag pullback: strong opening momentum, lighter-volume consolidation, and a late breakout attempt with the 3.89 price marker near the current candle.
USD/BRL
The real, quoted to 4 decimals like a G7 pair
BIG FIGURES
Levels such as 5.00 / 5.10 / 5.20 / 5.50
9 / 20 EMA
Where a clean trend pulls back to before continuing
B3 / NY HOURS
Sao Paulo runs on UTC-3, overlapping New York's day
Quick answer
How do you analyze a USD/BRL chart with AI?
Upload a screenshot of your USD/BRL chart and SnapPChart hands back a setup grade from A+ to F within seconds, plus an entry, a stop built off the chart's own structure, staged exit targets, and the reward measured against the risk. The read leans on three things visible in the image: the pullback into the 9 or 20 EMA, whether a big-figure level such as 5.00, 5.10, 5.20, or 5.50 is actually being respected, and whether the tick volume on the move supports it. That big-figure framing is deliberate. USD/MXN and USD/ZAR, the other emerging-market dollar crosses SnapPChart covers, are quoted to 2 decimals and trade around whole-peso or whole-rand marks; USD/BRL prices to 4 decimals instead, the same convention as EUR/USD or USD/CAD, and has ranged roughly between 4.89 and 5.61 reais to the dollar over the past year. Brazil's real has floated freely since January 1999, so there's no defended peg or managed band behind the chart, just a liquid major that carries two real-world stories on top of that: Banco Central do Brasil rate decisions on the Selic move it the way Banxico moves the peso, and Brazil's rank as a top exporter of iron ore, soybeans, coffee, and crude oil through Petrobras gives it a commodity-currency pull that shows up over longer stretches. None of that reaches the grader directly. It scores whatever pullback, big-figure reaction, and tick volume actually show up in your screenshot, applying one fixed rubric whether the chart was shaped by a rate decision, a soybean headline, or neither.
What the AI Returns From a Screenshot
Use the output as a repeatable pre-trade checkpoint, not a prediction.
A-F Setup Grade
See whether the setup has enough pattern clarity, momentum, volume, and reward to justify the risk.
Entry, Stop, Targets
Get a structured trade plan with entry zone, invalidation level, targets, and risk/reward.
Screenshot-Based Read
Use charts from TradingView, Webull, ThinkOrSwim, MetaTrader, Robinhood, or any broker.
Risk Notes First
The analysis flags extension, messy chop, weak retests, thin reward, and conflicting indicators.
Workflow
Put every USD/BRL screenshot through the same pre-entry check
The real's commodity ties and its higher-beta reaction to global risk sentiment can produce a pullback that looks clean but is really a risk-off spike settling down. Running the chart through an identical rubric every time catches that before you're already in the trade.
- Grade the USD/BRL pullback against the 9 or 20 EMA before sizing an entry
- Check whether a big-figure level (5.00, 5.10, 5.20, 5.50) is genuinely holding, not just nearby
- Rule out a risk-sentiment spike being mistaken for real trend continuation
- Confirm the tick volume on the pullback is light, not a wave of selling
- Read the bear case and invalidation level before committing size
- Walk away from a C-grade real setup even when the story sounds convincing
Head to head
SnapPChart vs a general AI chat assistant for chart screenshots
Most traders land here after pasting a chart into a general AI tool and getting a vague description. Here is how a purpose-built screenshot grader compares for the last decision before you risk money.
| Feature | SnapPChart | General AI chat assistant |
|---|---|---|
| Reads any chart screenshot | Every upload | Inconsistent |
| Setup grade (A+ to F) | Yes | No |
| Entry, stop, and targets | Every upload | Varies by prompt |
| Same criteria every time | Fixed methodology | Varies by prompt |
| Multi-target exit plan (T1 / T2) | Yes | Rarely consistent |
| Risk/reward + invalidation | Yes | Inconsistent |
| Speed to a decision | Seconds | Prompting required |
| Grade history to review | Yes | No |
Keep Learning the Setup
Use these guides to understand how SnapPChart grades the trade instead of taking the output blindly.
What do traders ask about USD/BRL Chart Analysis?
How SnapPChart grades a USD/BRL chart from a screenshot.
How do I analyze a USD/BRL chart with AI?
Take a screenshot of your USD/BRL chart from whatever platform you trade on and hand it to SnapPChart. The vision model works directly off the image: the distance of the pullback from the 9 and 20 EMA, whether a big-figure level is holding, and the tick volume printed on the move, then it returns a setup grade, an entry, a stop, targets, and the risk weighed against the reward. There's nothing to type in and no broker feed to connect.
Does it read live USD/BRL prices, the BCB's Selic decisions, or Brazil's commodity exports?
No. The screenshot is the entire input. SnapPChart doesn't watch a live USD/BRL quote, doesn't pull the Banco Central do Brasil's rate-decision calendar, and doesn't track iron ore, soybean, coffee, or crude oil prices behind Brazil's export economy. Those are real forces that move the pair over weeks and months, but they sit outside the grader entirely. What it scores is the pullback shape, the big-figure reaction, and the tick volume that actually show up in your upload, the same way on every chart.
Why does USD/BRL use big-figure levels instead of the whole-peso or whole-rand marks other EM pairs respect?
It comes down to scale. USD/MXN and USD/ZAR are both quoted to 2 decimals, so a level like 17.00 or 16.00 functions as their round number. USD/BRL prices to 4 decimals instead, the same convention as EUR/USD, so the levels that actually get respected are big figures such as 5.00, 5.10, 5.20, and 5.50, the way a trader would watch 1.1000 on a euro chart rather than a whole-dollar mark. The grader reads whichever round number the screenshot's own price scale points to, not a convention borrowed from a different pair.
Why does the New York session matter for grading USD/BRL?
B3, the exchange in Sao Paulo, sits on Brazil's own time zone, UTC-3, which overlaps closely with US trading hours, so USD/BRL sees its heaviest activity during the New York session, the same pattern behind USD/MXN rather than the London-session pattern behind USD/ZAR. A pullback built inside that active window carries more weight than one formed during a quiet overnight stretch, and the grader looks for that difference in the tick volume and structure it can actually see.
Why does Brazil's commodity-exporter status matter for grading USD/BRL?
Brazil ranks among the world's largest exporters of iron ore, soybeans, coffee, and crude oil, the last one through Petrobras, so the real carries a genuine commodity-currency pull layered on top of ordinary emerging-market volatility, in the same family as the rand's link to gold and platinum but running through an entirely different set of exports. That combination lets USD/BRL move further and faster than a G7 pair on the same piece of news. The grader isn't pricing any commodity itself; it's reading the pullback, the big-figure level, and the tick volume in the chart you send it.
Are the entry, stop, and targets in pips or real terms?
Real terms, at a G7-style pip size. Because USD/BRL prices to 4 decimals, a pip works out to 0.0001, matching EUR/USD or USD/CAD rather than the 2-decimal peso or rand convention. The entry, stop, and every target come back as real prices, something like 5.1230, with the reward measured against the risk on that same scale. The grader still wants a reward-to-risk that survives spread on a pair with this much intraday range.
Can it grade a USD/BRL short setup?
SnapPChart grades long and short momentum-continuation setups from chart screenshots. Choose Long only, Short only, or Both sides in your trading profile. Both sides picks one direction from the chart.
Is USD/BRL a free-floating, liquid pair?
Yes. Brazil moved to a free float on the real in January 1999 and has run one since, so USD/BRL is a genuinely floating, exchange-traded major, not a currency defended at a peg or kept inside a managed band. It carries the same confidence level as any other major FX pair SnapPChart covers, with the standing caveat that its commodity ties and emerging-market character mean it can swing harder than a G7 cross on the same headline.
Is USD/BRL chart analysis free to try?
Yes. New users get two lifetime chart analyses with no credit card required. The first shows the full depth of what the AI returns on a USD/BRL chart; the second is gated so you can see exactly what upgrading adds.
Grade your next USD/BRL setup before you enter.
Drop your real screenshot on the homepage and get a graded setup, entry, stop, and targets back in seconds, big figures and all. No credit card required.
Grade a USD/BRL Chart Free