Grade your AUD/NZD setup on the cross two commodity neighbors share a session on.
Australia and New Zealand sell into an overlapping set of buyers and have run a formal closer economic relations trade agreement since 1983, which tends to pull their currencies in the same direction against the rest of the world more often than it pulls them apart. SnapPChart reads a screenshot of your AUD/NZD chart for the pullback into the 9 and 20 EMA, whether a nearby whole-figure level is holding, and the visible tick volume, then hands back a setup grade, an entry, a stop, and staged targets weighed against the risk, on a pair that spends more of its time range-bound than most crosses on this site.
Drag and drop your chart screenshot
or click to browse. PNG, JPG, or WebP.
Your first analysis is free. No credit card.
Make sure both the time axis (X) and price axis (Y) are visible in your screenshot for accurate results.
Grade
B+
Entry
$3.87
Stop
$3.75
Target
$4.24
Sample readout
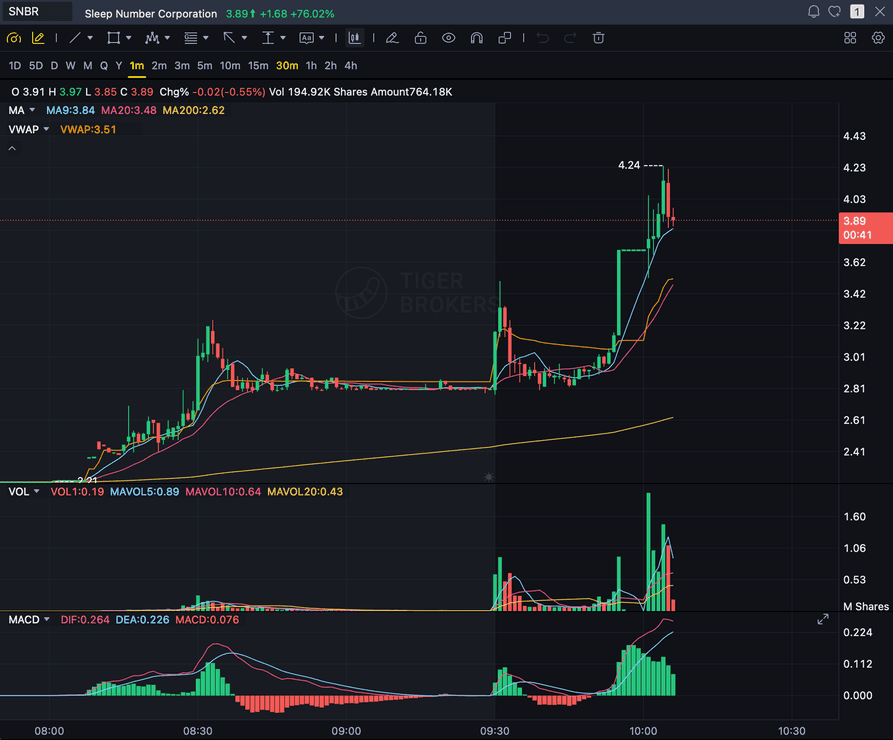
SNBR 1m bull flag pullback: strong opening momentum, lighter-volume consolidation, and a late breakout attempt with the 3.89 price marker near the current candle.
AUD/NZD
Two correlated commodity-currency neighbors
CER 1983
A formal closer-economic-relations trade tie since 1983
EMA
Pullback into the 9 and 20 EMA on a clean trend
RANGE-BOUND
Often tighter-ranging than a typical major cross
Quick answer
How do you analyze an AUD/NZD chart with AI?
Screenshot your AUD/NZD chart and upload it to SnapPChart, and the read comes back in seconds: a setup grade from A+ to F, an entry, a stop pulled from the chart's own structure, staged exit targets, and the reward weighed against the risk. Both currencies here get filed under commodity currency, but AUD/NZD sits differently on the board than a cross like AUD/CAD, where the two economies sell a different commodity to a different customer on opposite sides of the Pacific. Australia and New Zealand instead sell into a more overlapping set of buyers, both carry real exposure to Chinese demand, and the two countries have run a formal closer economic relations trade agreement since 1983, so their currencies tend to move together against the US dollar or the euro more often than they move against each other. That tendency to move together is a big part of why AUD/NZD carries a reputation as one of the tighter-ranging major-adjacent crosses on the board for long stretches, with a real trend usually needing something to actually split the two apart, the Reserve Bank of Australia and the Reserve Bank of New Zealand moving rates in different directions, or a divergence between hard-commodity demand like iron ore and coal versus soft-commodity demand like dairy and meat. Sydney and Wellington also sit close together in time, only a few hours apart depending on daylight saving, so unlike a cross where one leg's session has already gone quiet before the other opens, both currencies here are typically active during the same Asia-Pacific window instead of handing off between distant time zones. None of that trade-tie or policy-divergence story reaches the grader. It works from the pullback shape into the 9 and 20 EMA, the round-number levels visible on the chart, and the tick volume printed on the candles, scoring every AUD/NZD setup against the same fixed rubric regardless of which side of the Tasman is doing the pulling that week. Live quotes, the RBA or RBNZ calendar, and commodity prices all stay outside what it reads; the screenshot is the only input.
What the AI Returns From a Screenshot
Use the output as a repeatable pre-trade checkpoint, not a prediction.
A-F Setup Grade
See whether the setup has enough pattern clarity, momentum, volume, and reward to justify the risk.
Entry, Stop, Targets
Get a structured trade plan with entry zone, invalidation level, targets, and risk/reward.
Screenshot-Based Read
Use charts from TradingView, Webull, ThinkOrSwim, MetaTrader, Robinhood, or any broker.
Risk Notes First
The analysis flags extension, messy chop, weak retests, thin reward, and conflicting indicators.
Workflow
Use it as a pre-entry gate on every AUD/NZD setup
A pair that spends most of its life range-bound can still throw a pullback that looks like the start of a real trend, and telling the two apart from the chart alone is the actual skill here. SnapPChart runs the same structural check on the AUD/NZD chart before you commit to a read on which one you're looking at.
- Grade an AUD/NZD pullback into the 9 or 20 EMA before the entry
- Check the round-number level this Trans-Tasman cross is reacting to
- Confirm the tick volume actually backs the move, not just a range test
- Rule out a range-bound fade dressed up as a breakout
- Read the bear case and invalidation before you size the position
- Skip C-grade AUD/NZD setups where the reward doesn't clear the risk
Head to head
SnapPChart vs a general AI chat assistant for chart screenshots
Most traders land here after pasting a chart into a general AI tool and getting a vague description. Here is how a purpose-built screenshot grader compares for the last decision before you risk money.
| Feature | SnapPChart | General AI chat assistant |
|---|---|---|
| Reads any chart screenshot | Every upload | Inconsistent |
| Setup grade (A+ to F) | Yes | No |
| Entry, stop, and targets | Every upload | Varies by prompt |
| Same criteria every time | Fixed methodology | Varies by prompt |
| Multi-target exit plan (T1 / T2) | Yes | Rarely consistent |
| Risk/reward + invalidation | Yes | Inconsistent |
| Speed to a decision | Seconds | Prompting required |
| Grade history to review | Yes | No |
Keep Learning the Setup
Use these guides to understand how SnapPChart grades the trade instead of taking the output blindly.
What do traders ask about AUD/NZD Chart Analysis?
How SnapPChart grades an AUD/NZD chart from a screenshot.
How do I analyze an AUD/NZD chart with AI?
Take a screenshot of your AUD/NZD chart and drop it into SnapPChart. A vision model reads the pullback into the 9 and 20 EMA, the round-number reaction, and the visible tick volume straight off the image, then returns a setup grade, an entry, a stop, staged targets, and the risk-reward math. You never type out what the chart shows, and there is no broker connection or live feed involved.
Does it read live AUD/NZD prices, commodity prices, or the RBA and RBNZ calendar?
No. Nothing reaches the model except the screenshot you upload. There is no live AUD/NZD quote, no dairy, iron-ore, or coal price feed, no Reserve Bank of Australia or Reserve Bank of New Zealand rate decision, and no check against another currency pair. The trade ties and the China-demand exposure both economies share are useful background for you as the trader; the grade itself comes only from the pullback, the round-number level, and the volume printed on the candles in front of it.
Why is AUD/NZD more range-bound than most major crosses?
Australia and New Zealand sell into an overlapping set of buyers, both carry meaningful exposure to Chinese demand, and the two countries have operated under a formal closer economic relations trade agreement since 1983, so their currencies spend a lot of time drifting together against the rest of the world instead of pulling apart from each other. Add that Sydney and Wellington sit only a couple of hours apart, so both legs are typically active in the same window rather than one session picking up where the other left off, and you get a cross that needs a real catalyst, a genuine split between Reserve Bank of Australia and Reserve Bank of New Zealand policy, or a divergence between hard-commodity and soft-commodity demand, to break out of its usual range. The grader isn't pricing in either central bank or either commodity market. It reads the pullback shape, the round-number reaction, and the tick volume the same way regardless of which force, if any, is behind a given AUD/NZD chart.
Are the entry, stop, and targets in pips?
Yes. Like most non-yen crosses, AUD/NZD prices out to four or five decimal places, so a pip works out to 0.0001, and the entry, structural stop, and every target come back in that unit alongside the underlying price, with the reward measured against the risk. Because this cross tends to travel less per session than a wider-swinging pair like EUR/NZD, a stop sized for a typical major can end up wider than the chart actually calls for here, so check the structural stop against your own account risk rather than assuming a standard distance.
Can it grade an AUD/NZD short setup?
SnapPChart grades long and short momentum-continuation setups from chart screenshots. Choose Long only, Short only, or Both sides in your trading profile. Both sides picks one direction from the chart.
What actually moves AUD/NZD if the two currencies usually track each other?
The two most reliable splitters are policy and commodity mix. The Reserve Bank of Australia and the Reserve Bank of New Zealand don't always move on the same schedule or in the same direction, and when they diverge, the pair tends to trend rather than range. The other split is in what each economy actually sells: Australia leans on hard commodities like iron ore and coal, while New Zealand leans on soft, agricultural commodities like dairy and meat, so a shock to one category without the other, a Fonterra auction move with no matching shift in iron-ore demand, can put a real trend on the chart even while the broader China-linked correlation holds. The grader doesn't track either central bank's calendar or either commodity market. It scores whatever pullback, round-number reaction, and volume actually show up on the screenshot you upload, whether that's a genuine trend or the pair reverting back to its usual range.
Is AUD/NZD chart analysis free to try?
Yes. New users get two lifetime chart analyses, no credit card required. The first analysis shows the full depth of what the AI returns on an AUD/NZD chart; the second is gated so you can see what upgrading unlocks.
Grade your next AUD/NZD setup before you enter.
Bring your Trans-Tasman chart screenshot to the homepage and get a structured setup grade back in seconds, entry, stop, and targets included. No credit card required.
Grade an AUD/NZD Chart Free