Grade your EUR/GBP setup on the cross two neighboring economies actually trade through.
EUR/GBP pairs two developed economies separated by a narrow strip of water, each floating its own currency under its own central bank, with enough two-way goods trade crossing between them that a real portion of the flow behind this cross is a business settling an invoice rather than a trader taking a view. SnapPChart takes a screenshot of your EUR/GBP chart, works out how far price has pulled back toward the 9 and 20 EMA, checks whether a nearby round number is actually holding, and reads the tick volume printed on the move, before handing you a setup grade, an entry, a stop, and a run of scaled exits priced against the risk you would be taking.
Drag and drop your chart screenshot
or click to browse. PNG, JPG, or WebP.
Your first analysis is free. No credit card.
Make sure both the time axis (X) and price axis (Y) are visible in your screenshot for accurate results.
Grade
B+
Entry
$3.87
Stop
$3.75
Target
$4.24
Sample readout
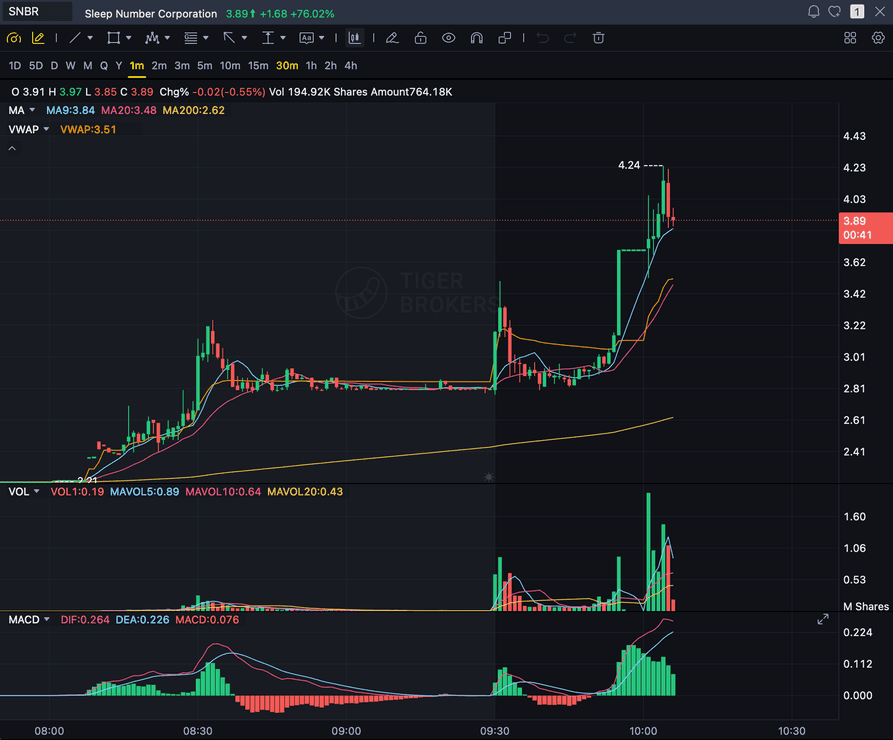
SNBR 1m bull flag pullback: strong opening momentum, lighter-volume consolidation, and a late breakout attempt with the 3.89 price marker near the current candle.
EUR/GBP
Two free-floating economies, no USD leg
TRADE LINK
UK-EU goods trade feeds real invoicing flow
EMA
Pullback into the 9 and 20 EMA on a clean trend
ECB / BOE
Two independent central banks, not always in sync
Quick answer
How do you analyze a EUR/GBP chart with AI?
Send SnapPChart a screenshot of your EUR/GBP chart and within seconds you get back a full read: a letter grade from A+ to F, an entry, a stop pulled from the structure it can see, a set of scaled exit targets, and the reward measured against the risk. What makes this cross worth grading differently starts with what it isn't. Both the euro and the pound float freely against the market, so there's no defended floor to think about the way there is on EUR/CHF, and neither currency stands in for one commodity's price the way the Australian or Canadian dollar sometimes does. What EUR/GBP actually carries behind it is an unusually large volume of ordinary commerce: the EU takes in roughly 40% of everything the UK ships abroad and supplies close to half of everything the UK brings in, and every one of those invoices eventually gets converted between euros and pounds. Central-bank research into London's FX derivatives market, the single largest venue anywhere for trading currency, has found that non-financial companies, pension funds, and insurers turn to currency derivatives mainly to hedge real trade and investment exposure, while speculating on momentum, carry, or a macro call is more of a hedge-fund specialty. A cross carrying this much genuine UK-EU trade plausibly leans more on that hedging demand than a chart shaped mostly by short-term positioning, though nobody publishes an exact split by currency pair. There's a policy angle too: across 2026 the European Central Bank and the Bank of England didn't move together, one raising rates while the other sat still, a pattern that resurfaces periodically now that the two economies' business cycles have room to diverge. SnapPChart isn't reading any of that history or policy backdrop. Its whole input is the screenshot in front of it: the EMA pullback, whether a round number is holding, and the tick volume on the move, scored to one fixed standard no matter which of those forces actually produced the chart.
What the AI Returns From a Screenshot
Use the output as a repeatable pre-trade checkpoint, not a prediction.
A-F Setup Grade
See whether the setup has enough pattern clarity, momentum, volume, and reward to justify the risk.
Entry, Stop, Targets
Get a structured trade plan with entry zone, invalidation level, targets, and risk/reward.
Screenshot-Based Read
Use charts from TradingView, Webull, ThinkOrSwim, MetaTrader, Robinhood, or any broker.
Risk Notes First
The analysis flags extension, messy chop, weak retests, thin reward, and conflicting indicators.
Workflow
Use it as a pre-entry gate on every EUR/GBP setup
Whether a EUR/GBP pullback grew out of routine corporate hedging or a burst of short-term positioning, the candles arrive with no label attached, and a setup either holds up structurally or it doesn't regardless of who put it there. SnapPChart gives you a consistent quality check on the EUR/GBP chart before you commit.
- Grade a EUR/GBP pullback into the 9 or 20 EMA before the entry
- Check the round-number level the euro-sterling cross is reacting to
- Confirm the tick volume behind the move actually backs up the pullback
- Judge the structure on its own terms rather than guessing who is behind the flow
- Read the bear case and invalidation before you size the position
- Pass on C-grade EUR/GBP setups where the reward doesn't clear the risk
Head to head
SnapPChart vs a general AI chat assistant for chart screenshots
Most traders land here after pasting a chart into a general AI tool and getting a vague description. Here is how a purpose-built screenshot grader compares for the last decision before you risk money.
| Feature | SnapPChart | General AI chat assistant |
|---|---|---|
| Reads any chart screenshot | Every upload | Inconsistent |
| Setup grade (A+ to F) | Yes | No |
| Entry, stop, and targets | Every upload | Varies by prompt |
| Same criteria every time | Fixed methodology | Varies by prompt |
| Multi-target exit plan (T1 / T2) | Yes | Rarely consistent |
| Risk/reward + invalidation | Yes | Inconsistent |
| Speed to a decision | Seconds | Prompting required |
| Grade history to review | Yes | No |
Keep Learning the Setup
Use these guides to understand how SnapPChart grades the trade instead of taking the output blindly.
What do traders ask about EUR/GBP Chart Analysis?
How SnapPChart grades a EUR/GBP chart from a screenshot.
How do I analyze a EUR/GBP chart with AI?
Take a screenshot of your EUR/GBP chart from whatever platform you trade on and upload it to SnapPChart. A multimodal vision model reads the pullback into the 9 and 20 EMA, the round-number levels, and the tick volume directly from the image, then returns a setup grade, an entry, a stop, targets, and the reward against the risk. Nothing needs to be typed in and no data feed gets connected; the screenshot carries the whole analysis.
Does it read live EUR/GBP prices, UK-EU trade data, or the ECB and Bank of England calendar?
No. Everything the grader knows comes from the screenshot you upload. It does not read live EUR/GBP prices, does not track UK-EU trade or customs data, does not pull the European Central Bank or Bank of England policy calendar, and does not cross-reference other currency pairs. The trade-invoicing flow and the central-bank backdrop described above are useful context for you as the trader; the grader sticks to what is visible on the chart: the EMA pullback, the round numbers, and the tick volume.
Why does EUR/GBP carry more real-money trade flow than a commodity cross?
The UK and the eurozone run one of the largest two-way trading relationships between any two economies, with the EU taking roughly 40% of UK goods exports and supplying around half of UK goods imports. Every invoice in that relationship eventually gets settled in euros or pounds, a fundamentally different source of currency demand than a pair like AUD/CHF or GBP/AUD, where one side's value tracks a single commodity export. Central-bank research on London's FX derivatives market backs up the general pattern: non-financial corporations and pension funds use currency derivatives mostly to hedge real trade and investment exposure, while speculative positioning concentrates more heavily among hedge funds. None of this changes how the grader scores a chart; it is context for why EUR/GBP behaves differently over long stretches, not something built into the rubric.
Why do the ECB and the Bank of England keep moving out of step?
The pound and the euro have always been separate currencies with separate central banks; the UK never adopted the euro, before or after leaving the EU. What changed once the UK left the EU in 2020 is that the two economies' business cycles gained more room to drift apart: different energy-price pass-through, different labor-market shocks, different fiscal choices, and a customs border that didn't exist before. Through 2026 that showed up directly in policy, with the European Central Bank and the Bank of England moving at different speeds, an example of the kind of divergence traders now watch for on this pair. The grader doesn't track either central bank's calendar or try to anticipate the next move. It scores the pullback, the round-number reaction, and the tick volume actually visible in the screenshot you upload, whichever direction the two central banks happen to be leaning that week.
Are the entry, stop, and targets in pips?
Yes, given in pips next to the underlying prices. Like most pairs without a yen leg, EUR/GBP prices out to four decimal places, so one pip equals 0.0001, and the grader hands back the entry, the stop, and every target in that format with the reward-to-risk figured the same way. This pair tends to cover less ground per session than a wider-swinging cross like EUR/NZD, so check that the stop distance still clears your broker's spread and your own minimum reward-to-risk before sizing the position.
Can it grade a EUR/GBP short setup?
SnapPChart grades long and short momentum-continuation setups from chart screenshots. Choose Long only, Short only, or Both sides in your trading profile. Both sides picks one direction from the chart.
Is EUR/GBP chart analysis free to try?
Yes. New users get two lifetime chart analyses, no credit card required. The first analysis shows the full depth of what the AI returns on a EUR/GBP chart; the second is gated so you can see what upgrading unlocks.
Grade your next EUR/GBP setup before you enter.
Upload the euro-sterling screenshot from the homepage and get a structured read on the setup, an entry, a stop, and targets in seconds. No credit card required.
Grade a EUR/GBP Chart Free