Grade your EUR/AUD setup in the handoff between Asia-Pacific and Europe.
The Australian dollar and the euro almost never share a trading desk's clock. Sydney and Tokyo carry the Aussie side of this cross for hours before Frankfurt or London even open, and once European desks do take over, the Asian order flow that shaped the earlier candles is already closing out for the day. SnapPChart doesn't try to guess which half of that day produced your EUR/AUD screenshot. It works off three things visible in the image: how far price has pulled back toward the 9 and 20 EMA, whether a round number close by is actually being respected, and whether the tick volume printed on the move backs it up. From there it returns a setup grade, an entry, a stop, and a run of staged exit targets, priced against the risk you'd be taking.
Drag and drop your chart screenshot
or click to browse. PNG, JPG, or WebP.
Your first analysis is free. No credit card.
Make sure both the time axis (X) and price axis (Y) are visible in your screenshot for accurate results.
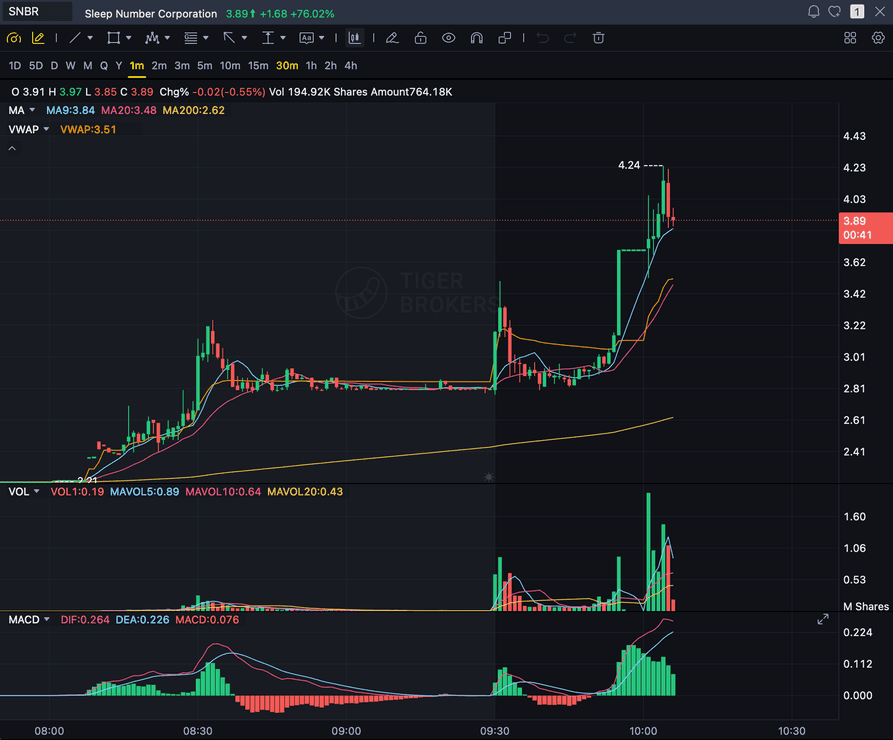
Grade
B+
Entry
$3.87
Stop
$3.75
Target
$4.24
Sample readout
SNBR 1m bull flag pullback: strong opening momentum, lighter-volume consolidation, and a late breakout attempt with the 3.89 price marker near the current candle.
EUR/AUD
No USD leg, split across two time zones
00:00-09:00 UTC
Asian session, when the Aussie dollar trades heaviest
EMA
Pullback into the 9 and 20 EMA on a clean trend
US HOURS
Neither home desk open, liquidity commonly dries up
Quick answer
How do you analyze a EUR/AUD chart with AI?
Feed SnapPChart a screenshot of your EUR/AUD chart, and the read comes back in seconds: a setup grade from A+ to F, an entry, a stop pulled from the chart's own structure, staged exit targets, and the reward weighed against the risk. What makes the timing on this pair different from a dollar pair is straightforward: neither leg has the US dollar sitting on the other side of it, so there's no New York session automatically keeping the cross alive the way EUR/USD or AUD/USD stays busy around the clock. FX-education sources generally describe two windows worth knowing on EUR/AUD. The first runs roughly 00:00 to 09:00 UTC, while Sydney and Tokyo desks are open and doing most of the Australian-dollar-side work. The second is the short overlap into London, commonly placed around 07:00 to 09:00 UTC, when euro desks arrive and briefly trade alongside the tail of the Asian session. Several of those same sources flag the opposite case too: once the European afternoon fades and only New York-only hours remain, EUR/AUD is described as thinner and choppier, wider spreads, less follow-through, because neither home market has a desk open at that point. The grader isn't reading any of that timing. It scores the pullback shape, the round-number reaction, and the tick volume printed on whatever screenshot you give it, using one fixed rubric regardless of what time the chart was taken.
What the AI Returns From a Screenshot
Use the output as a repeatable pre-trade checkpoint, not a prediction.
A-F Setup Grade
See whether the setup has enough pattern clarity, momentum, volume, and reward to justify the risk.
Entry, Stop, Targets
Get a structured trade plan with entry zone, invalidation level, targets, and risk/reward.
Screenshot-Based Read
Use charts from TradingView, Webull, ThinkOrSwim, MetaTrader, Robinhood, or any broker.
Risk Notes First
The analysis flags extension, messy chop, weak retests, thin reward, and conflicting indicators.
Workflow
Use it as a pre-entry gate on every EUR/AUD setup
Knowing a pullback formed during the Asian hours instead of the London handoff doesn't tell you whether the setup earns an entry; the chart still has to hold up on its own terms. Put every EUR/AUD screenshot through the same read before you decide that.
- Grade a EUR/AUD pullback into the 9 or 20 EMA before the entry
- Check the round-number level this euro-Aussie cross is reacting to
- Rule out a tick-volume spike that's really just a session opening, not real conviction
- Weigh whether the setup formed in the Asia-to-Europe handoff or the quieter stretch after it
- Read the bear case and invalidation before you size the position
- Skip C-grade EUR/AUD setups where the reward doesn't clear the risk
Head to head
SnapPChart vs a general AI chat assistant for chart screenshots
Most traders land here after pasting a chart into a general AI tool and getting a vague description. Here is how a purpose-built screenshot grader compares for the last decision before you risk money.
| Feature | SnapPChart | General AI chat assistant |
|---|---|---|
| Reads any chart screenshot | Every upload | Inconsistent |
| Setup grade (A+ to F) | Yes | No |
| Entry, stop, and targets | Every upload | Varies by prompt |
| Same criteria every time | Fixed methodology | Varies by prompt |
| Multi-target exit plan (T1 / T2) | Yes | Rarely consistent |
| Risk/reward + invalidation | Yes | Inconsistent |
| Speed to a decision | Seconds | Prompting required |
| Grade history to review | Yes | No |
Keep Learning the Setup
Use these guides to understand how SnapPChart grades the trade instead of taking the output blindly.
What do traders ask about EUR/AUD Chart Analysis?
How SnapPChart grades a EUR/AUD chart from a screenshot.
How do I analyze a EUR/AUD chart with AI?
Capture a screenshot of your EUR/AUD chart from whatever platform you use and hand the image to SnapPChart. The vision model checks three things straight off the picture: the size of the pullback relative to the 9 and 20 EMA, whether a round number close by is actually being respected, and whether the tick volume on the move supports it. What comes back is a setup grade, an entry, a stop, staged exit targets, and the risk measured against the reward, without you describing the chart yourself or connecting a broker account.
Does it read live EUR/AUD prices, an economic calendar, or other currency pairs?
No, and that holds across the board here. The screenshot is the only thing SnapPChart looks at: it isn't watching a live EUR/AUD quote, isn't pulling anything off the RBA's or the ECB's calendar, and isn't peeking at the AUD/USD or EUR/USD legs to backfill what this cross is doing. All of that macro context is useful for you to carry into the trade; the grade itself is built only from the pullback, the round-number reaction, and the volume that show up in the image you send it.
Why does EUR/AUD trade differently by time of day than a dollar-leg pair does?
Neither currency in this cross has the US dollar sitting opposite it, so the pair leans on its own two home markets instead of the New York session that keeps a pair like EUR/USD or AUD/USD busy at every hour. FX-education sources generally point to the Asian session, roughly 00:00 to 09:00 UTC, as when Sydney and Tokyo desks are running the Australian-dollar side, and to the short window where that session hands off to London, often placed around 07:00 to 09:00 UTC, as when the euro side wakes up too. Once the European afternoon winds down and only New York-only hours are left, several of those same sources describe EUR/AUD specifically as harder to trade: wider spreads, choppier price action, less real participation, because neither home desk is actually open. A dollar-leg pair doesn't get that quiet stretch, since the dollar itself trades somewhere in every session including New York's. None of this reaches the grader as a clock. It scores whatever pullback, round-number reaction, and tick volume actually show up on the screenshot, whether that screenshot happened to be taken during the handoff or during the slower hours after it.
Are the entry, stop, and targets in pips?
Yes, reported the way most non-yen crosses are: EUR/AUD prices to four or five decimals, putting a pip at 0.0001, and the grade includes the entry, the stop, and every target expressed that way, with the risk-to-reward worked out in the same unit. Spreads on this cross are known to widen once liquidity dries up during the late US hours, so double-check that the stop distance still makes sense for whatever window you're actually trading in.
Can it grade a EUR/AUD short setup?
SnapPChart grades long and short momentum-continuation setups from chart screenshots. Choose Long only, Short only, or Both sides in your trading profile. Both sides picks one direction from the chart.
Is EUR/AUD's session pattern something SnapPChart tracks live?
No. The session pattern described above is general market structure pulled from FX-education sources, not something the grader watches as it happens. SnapPChart has no idea what time it is when you upload a chart, doesn't check a clock, and doesn't adjust a grade based on when you're trading. A screenshot taken at 8 a.m. UTC and one taken at 8 p.m. UTC get scored by the identical pullback, round-number, and volume checks. The timing context belongs to you as the trader, not to the score.
Is EUR/AUD chart analysis free to try?
Yes. New users get two lifetime chart analyses, no credit card required. The first analysis shows the full depth of what the AI returns on a EUR/AUD chart; the second is gated so you can see what upgrading unlocks.
Grade your next EUR/AUD setup before you enter.
Drop your euro-Aussie screenshot on the homepage and walk away with a graded setup, entry, stop, and targets, no matter which session window it came from. No credit card required.
Grade a EUR/AUD Chart Free