Grade the bearish fair value gap before you short the retest.
Upload a chart where a sharp drop left a bearish fair value gap overhead and price has crept back up into it, and get a read on the downtrend, how big the rally got, the candle that met the gap, what volume did on the way down and on the way back up, and a short trade plan when the setup earns one.
Drag and drop your chart screenshot
or click to browse. PNG, JPG, or WebP.
Your first grade is free, no card: a summarized analysis of your chart and a graded second opinion on whether to take it, wait or pass. Entry, stop, targets and the trade plan come with a paid plan.
Make sure both the time axis (X) and price axis (Y) are visible in your screenshot for accurate results.
Grade
B+
Entry
$3.87
Stop
$3.75
Target
$4.24
Format example (stock chart)
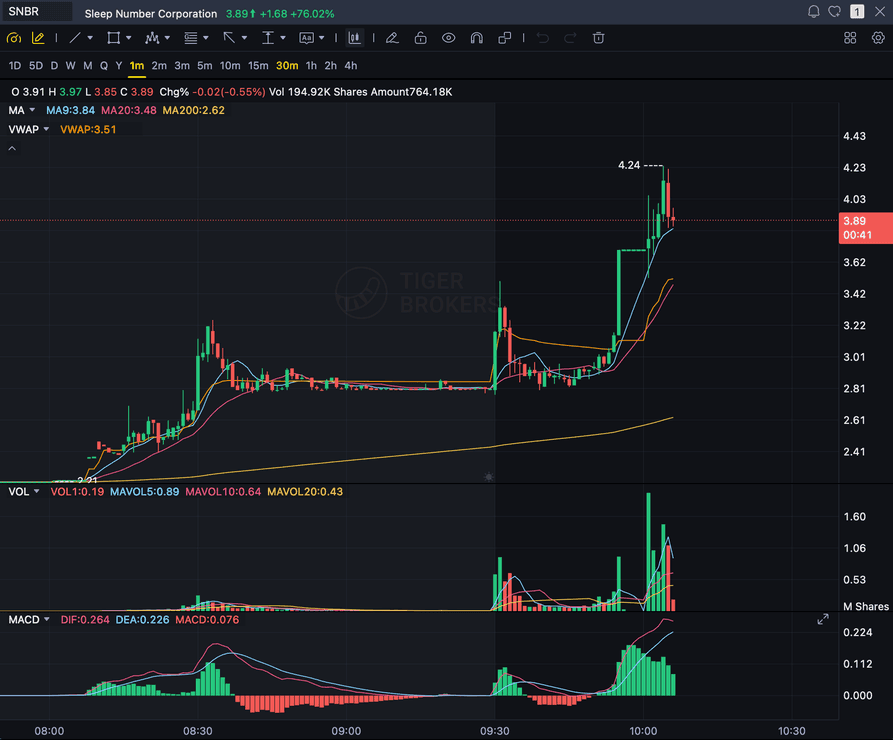
SNBR 1m bull flag pullback: strong opening momentum, lighter-volume consolidation, and a late breakout attempt near 3.89. Forex, crypto and futures screenshots get the same structure: a grade, entry, structural stop and targets.
GAP TOP
Candle 1's low, the far edge a short stop sits above
CE 50%
The gap's midpoint, a common place to sell the rally
DISPLACEMENT
The wide red candle 2 that broke the last swing low
SWING LOW
The low the drop broke, the usual first target
Quick answer
What is a bearish fair value gap, and can AI grade it?
A bearish fair value gap (FVG) is a three-candle imbalance left by a sharp drop: candle 1's low sits above candle 3's high, and the price range between them is the gap. In a downtrend, traders short the rally back up into that gap, or its 50% midpoint, when it gets rejected. SnapPChart grades that short from your screenshot.
Read the gap off the wicks. Candle 2 is the wide red displacement candle; candle 1's low and candle 3's high are the two edges, and if those wicks overlap there is no gap. It is not a hole where nothing traded, since candle 2 traded straight through it. It marks a stretch price crossed so fast that sellers met almost no buyers, which is why the zone tends to act as resistance on the way back up. Context decides whether it is worth anything. The drop that left the gap should break the last swing low on a chart already printing lower highs and lower lows. In a sideways range, gaps overlap and fail, and a gap that fights the bigger trend is a weaker bet. Confluence helps: an old support level now overhead, a bearish order block, or a falling 20 EMA or VWAP sitting in the same zone. Then the return. Traders sell the lower edge, sell the 50% midpoint (ICT calls it consequent encroachment), or wait for a candle that pokes into the gap and closes back below it. The stop goes above the gap's top, or above the displacement candle's high for more room, and the first target is usually the swing low the drop broke, then the next support or an unfilled bullish gap lower down. A candle that closes above the gap's top kills the idea; a wick through it does not. Plenty of gaps are never revisited at all, and that is a trade you never had, not one you missed. SnapPChart grades this short from the screenshot you upload. The ICT concepts note on your result names a bearish gap and its price range when it can see one, but that note is shown to you, not scored. The grade comes from the downtrend, the size of the rally into overhead resistance, the candle that meets it, volume on the drop and the rally when the bars are legible, whether this is the first, second, or third rally of the move, and the room down to the next support. You get a grade on the A+ to F scale and a take it, wait, or skip call; when the plan clears roughly 2:1 on the risk, counting half off at each target when there are two, it adds a short entry, a stop above resistance, and targets. Entry, stop, targets and the trade plan come with a paid plan. It reads one image: no order flow, no other timeframe, no news, and nothing about borrow or halts.
What the AI Returns From a Screenshot
Use the output as a repeatable pre-trade checkpoint, not a prediction.
A+ to F Setup Grade
See whether the setup has enough pattern clarity, momentum, volume, and reward to justify the risk.
Entry, Stop, Targets
Get a structured trade plan with entry zone, invalidation level, targets, and risk/reward.
Screenshot-Based Read
Use charts from TradingView, Webull, ThinkOrSwim, MetaTrader, Robinhood, or any broker.
Risk Notes First
The analysis flags extension, messy chop, weak retests, thin reward, and conflicting indicators.
Workflow
Grade the rally into the gap, not the gap itself
A bearish gap is a place to watch, not an entry. The usual mistakes are selling the first touch before any candle has closed, or shorting a gap inside a range where gaps overlap and fail. SnapPChart runs the same short-side checks on every upload, so the decision does not rest on how badly you want the trade.
- Box the gap from candle 1's low to candle 3's high, using wicks, so you can check the read against your own
- Confirm the drop that left it broke the last swing low and the chart is printing lower highs and lower lows
- Wait for the candle inside the gap to close before you screenshot; a wick to the midpoint can still close above the top
- Keep volume on the chart so the read can compare the selling leg with the rally
- Note whether this is the first rally into the gap or a later one after earlier tests
- Pass when a candle closes above the gap's top, the chart is ranging, or there is no room down to the next support
Head to head
SnapPChart vs a general AI chat assistant for bearish FVG shorts
A general AI tool will happily point at a gap on your chart and call it bearish. Whether it then checks that the chart is trending down rather than ranging, that the rally into the gap stayed small, and that a candle actually turned back under it depends on how you prompt it that day. SnapPChart runs one short-side checklist on every screenshot, and it tells you plainly that the gap note on your result is shown to you, not scored.
| Feature | SnapPChart | General AI chat assistant |
|---|---|---|
| Grades the short off a rally into a bearish gap | Yes, every upload | Inconsistent |
| Never calls a short on an established uptrend; a forced short there grades down | Every grade | Rarely |
| Reads the candle at overhead resistance: upper wick, shooting star, red engulfing | From the image | Varies by prompt |
| Docks a rally that took back more than half of the drop | Built into the grade | Rarely |
| Compares volume on the selling leg with volume on the rally | When the bars are legible | Rarely |
| Short entry, a stop above resistance, and downside targets | Yes, on paid plans | Prompting required |
| Drops a short whose plan pays under about 2:1 | Checked on every plan | Up to you |
Learn the bearish fair value gap
The long-side mirror, the SMC read that names gaps on every upload, and the guides behind ICT and short selling, so you know why a gap short grades the way it does rather than taking the letter on faith.
What do traders ask about Bearish FVG AI?
How SnapPChart grades a bearish fair value gap short from your screenshot.
How does the AI grade a bearish fair value gap short?
It does not score the gap box itself. The read writes an ICT concepts note naming any bearish gap it can see, with its price range and whether it has been filled, and that note shows on your result, but it is kept out of the grade. The grade is built from what makes the short work: lower highs and lower lows, price under falling EMAs or VWAP when they are plotted, a rally of one to three candles up into overhead resistance rather than a recovery, and the candle that meets it. A long upper wick, a shooting star, or a red engulfing candle counts toward the short; a hammer or a green engulfing candle counts against it. Heavy selling on the drop and light buying on the rally help when the volume bars are readable. What comes back is the grade, a take, wait, or skip call, and a short plan if the risk and reward add up.
Should I short the lower edge, the 50% midpoint, or wait for a rejection candle?
Each one costs something. A limit at the lower edge fills on any rally that reaches the gap, but it gets the worst price and the widest stop. A limit at the midpoint gets a better price and a tighter stop, but a shallow rally can turn without filling it, and it also fills during a rally that keeps going straight through. Waiting for a candle that tags the gap and closes back below it, then selling the next candle or the break of that candle's low, gives up some price for proof that sellers showed up. SnapPChart does not choose a method for you. It reads where price is now: if the rejection is happening, the call can be take it now with an entry near the current price; if price has already dropped away from the gap, it usually says wait and gives a conditional short entry at a resistance level it read off the chart, which may or may not be the edge of your gap.
Where do the stop and targets go on a bearish FVG short?
The stop goes above the gap's top, which is candle 1's low, so a rally that only reaches the midpoint does not take you out. Many traders put it higher still, above the displacement candle's high or the last swing high, because wicks poke into gaps all the time and a stop parked just over the midpoint gets run. The first target is usually the swing low the drop broke; after that, the next support, the prior day's low, or an unfilled bullish gap further down. Covering part at the first target and trailing the rest is common. SnapPChart sets its own stop above the resistance it reads and explains why it sits there, and if the plan pays under about 2:1 on the risk, counting half off at each target when there are two (2.5:1 on forex), it is dropped and the call turns to skip.
What is the difference between a bullish and a bearish FVG?
They are mirror images. A bullish gap is left by a sharp rally: candle 1's high sits below candle 3's low, the gap sits under price, and traders buy the pullback into it as support. A bearish gap is left by a sharp drop: candle 1's low sits above candle 3's high, the gap sits over price, and traders short the rally into it as resistance. Some explainers say a bearish gap means price will rise to fill it. That rally is the part you wait through; the trade is the drop that follows when the gap holds. An inverse FVG is a different idea, a gap price has already closed through that some traders then treat as the opposite side, and it is not what this page covers. The long version has its own page, Fair Value Gap AI.
Is a bearish fair value gap short a reversal trade?
No. The gap short joins a downtrend that is already in place. On Both sides, or with no profile set, the grader takes the direction from the chart: it does not call a short on an established uptrend, however red the latest candles look, and a sideways range with no downtrend to join usually does not get called a short either. So the first hard drop after a long run up, gap or no gap, is not this setup. A Short only profile runs the short checks on every chart, and an uptrend then counts as fighting the trend, which pulls the grade down.
What makes a bearish FVG short fail?
The clean failure is a candle that closes above the gap's top and holds, especially on rising buying volume. The grade picks up warning signs before that: a rally that has already taken back more than half of the whole drop (a different 50% from the gap's midpoint, and it pulls the grade down), a third rally into the zone after two earlier tests, or a short taken long after price has dropped away. On stock charts, price above VWAP is a no-go for a short, and an outsized green volume bar elsewhere on the chart can trigger one too; a no-go grades F. And many gaps are simply never revisited, in which case there is nothing to grade.
Which timeframe works best for bearish fair value gaps?
The pattern reads the same on any timeframe. On 1 and 5 minute charts you will see lots of gaps and many fill within minutes, so each one carries less weight; hourly, 4 hour, and daily gaps print less often and tend to stay relevant longer. A common workflow marks the gap on the higher timeframe and times the entry on a lower one. SnapPChart grades one screenshot, so if the higher timeframe matters to your short, and it usually does, grade that chart separately and put the two reads side by side.
Can it see order flow, other timeframes, or whether I can borrow the stock?
No. Footprint, delta, and the order book are not in a screenshot, so it reads volume only from the bars on your chart and treats unreadable bars as missing, not weak. It does not see a timeframe you did not upload, stream price, read news, spot trading halts, or know anything that happened after the image was taken. It does not draw gaps, scan for them, or send alerts. You place and manage trades through your own broker. SnapPChart does not execute orders, locate shares, or check borrow fees or margin availability.
Is there a free trial for bearish fair value gap grading?
Yes. New accounts get one free grade. You get a summarized analysis of your chart and a graded second opinion on whether to take it, wait or pass. Entry, stop, targets and the trade plan come with a paid plan. No card needed to try it. Run it on the next bearish gap you are watching to see how the short grades.
Grade the rejection inside the gap before you sell the rally.
Box the gap, let the candle inside it close, keep volume on screen, then drop the screenshot on the homepage uploader and see how the short grades.
Grade a Bearish FVG Short Free