Check whether your bullish Crab's fixed 1.618 completion at D has actually confirmed before you trade the pullback.
SnapPChart grades a bullish Crab once D has completed at the mandatory 1.618 extension of XA, a confirmation signal has printed, and a fresh uptrend is underway: upload the screenshot for a read on whether that turn is holding, whether higher highs and higher lows have followed, what the volume looks like, and a complete trade plan. A Crab that has only reached its fixed completion ratio and one that has already confirmed into a new uptrend are different charts, and only the second one gets graded here.
Drag and drop your chart screenshot
or click to browse. PNG, JPG, or WebP.
Your first analysis is free. No credit card.
Make sure both the time axis (X) and price axis (Y) are visible in your screenshot for accurate results.
Grade
B+
Entry
$3.87
Stop
$3.75
Target
$4.24
Sample readout
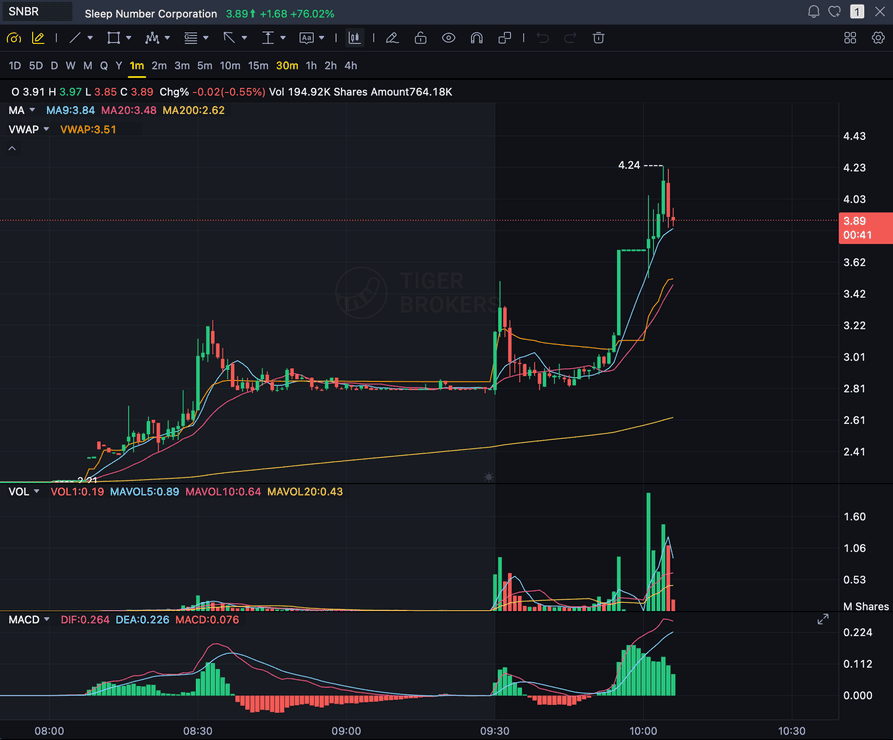
SNBR 1m bull flag pullback: strong opening momentum, lighter-volume consolidation, and a late breakout attempt with the 3.89 price marker near the current candle.
XABCD
The five points, X, A, B, C, and D, you marked on your chart
1.618 XA
The fixed extension ratio D must complete at, not a range
CONFIRMATION SIGNAL
The reversal candle, divergence, or trendline break confirming a turn at D
VOLUME
Whether the move away from D came on conviction or thin volume
Quick answer
What is a bullish Crab pattern, and can AI grade it?
Scott Carney formalized the bullish Crab in 2000: a five-point XABCD pattern where D completes at a fixed 1.618 extension of the XA leg, a single ratio rather than a range, making it the deepest completion point in the harmonic family. SnapPChart never calls that turn; it grades the pullback only once a confirmation signal and a new uptrend have already printed above D.
Five points carry the Crab's structure, X, A, B, C, and D, the same labeling Carney used across most of the harmonic family before Darren Oglesby's Cypher and Carney's own Shark changed the formula. The opening decline runs from X to A. B corrects that move somewhere between 38.2% and 61.8% of the XA leg, the identical window a Gartley's B or a Cypher's B can also sit in, so a retracement in that range tells you almost nothing about which pattern you're looking at on its own. C then pulls back 38.2% to 88.6% of the AB swing. Everything that actually separates a Crab from its siblings happens at the very end: D is not allowed to land anywhere across a band the way it does on a Gartley (roughly a 78.6% retracement, still inside the original XA range), a Butterfly (127% to 161.8% beyond X, a wide extension zone), or a Cypher (a 78.6% retracement of the XC leg entirely, a different leg than XA). A Crab's D is pinned to one number: a 1.618 extension of XA, full stop, usually arriving alongside a secondary confluence where CD has also stretched 2.24 to 3.618 times the length of BC. That 1.618 print is the single deepest, most extended completion point of any pattern in this family, further past the starting leg than even Butterfly's widest reading. The part worth sitting with is that a fixed ratio, rather than loosening the read, tightens it: Carney's own writing on the Crab, echoed by multiple independent chart-pattern references, singles it out as one of the more precise potential reversal zones in harmonic trading, precisely because there is one number to hit rather than a wide band to land inside. The deepest swing in the family produces the narrowest target. None of that licenses buying the print the instant price arrives there. A decline that has only just reached the 1.618 extension, with nothing else on the chart, is still a decline in progress by SnapPChart's read, and that restraint mirrors what the Crab's own trading literature already recommends: wait for the market to actually turn off that zone, a reversal candle, a bullish divergence, or a broken trendline, before treating D as anything more than a level worth watching. SnapPChart holds to that same line. Grading switches on only once one of those signals has printed at D and a fresh uptrend, higher highs stacked on higher lows, is already running above it; what gets graded is the first pullback inside that confirmed advance, never the raw tag of the extension zone itself. Upload a screenshot with the X, A, B, C, and D points marked, the Fibonacci ratios labeled at each leg using your own charting platform's tools, the confirmation signal visible, and the new uptrend already in view, and SnapPChart reads that structure back: whether the ratios actually converge the way a Crab's should, whether the confirmation genuinely held, how the volume behind the move looks, and whether the higher highs and higher lows are real. From there it returns a setup grade, an entry on the pullback, a stop placed just beyond the 1.618 extension of XA past D, multiple exit targets, and the case against the trade. It will not plot the five points for you, calculate any of the retracement or extension math, scan a live feed hunting for Crabs, or decide on its own that the reversal at D has happened. That reading, start to finish, stays yours to do before the chart ever reaches an upload button.
What the AI Returns From a Screenshot
Use the output as a repeatable pre-trade checkpoint, not a prediction.
A-F Setup Grade
See whether the setup has enough pattern clarity, momentum, volume, and reward to justify the risk.
Entry, Stop, Targets
Get a structured trade plan with entry zone, invalidation level, targets, and risk/reward.
Screenshot-Based Read
Use charts from TradingView, Webull, ThinkOrSwim, MetaTrader, Robinhood, or any broker.
Risk Notes First
The analysis flags extension, messy chop, weak retests, thin reward, and conflicting indicators.
Workflow
Confirm the fixed 1.618 completion at D before you trade the pullback
A lot of Crab setups fail right at D: the confirmation signal never shows, price runs straight through the 1.618 extension of XA without turning, or the uptrend that's supposed to follow never stacks higher highs. SnapPChart checks whether this particular Crab has actually confirmed before you commit capital to the pullback that comes next.
- Plot X, A, B, C, and D, keeping B inside 38.2%-61.8% of XA and C inside 38.2%-88.6% of AB, then label every ratio with your platform's Fibonacci tools
- Confirm D landed at the fixed 1.618 extension of XA, not a nearby estimate, and check whether CD also reached the 2.24-3.618 extension of BC for extra confluence
- Wait for a confirmation signal at D, a reversal candle, bullish divergence, or a broken trendline, before treating the zone as anything more than a level to watch
- Check whether a genuine uptrend has started off D, with higher highs stacking on higher lows
- Read the volume behind the move away from D: real conviction or a thin, unconvincing push
- Grade the first pullback inside that confirmed uptrend, never the raw tag of the 1.618 extension zone
Head to head
SnapPChart vs a general AI chat assistant for bullish Crab setups
Hand a general AI chat assistant a chart and ask about a Crab, and you get a guess, not a fixed check: it might recognize the XABCD shape, but it will not reliably confirm that D actually landed at the mandatory 1.618 extension of XA rather than somewhere close to it, that B and C stayed inside their own retracement windows, or that a confirmation signal printed before calling the zone tradeable. SnapPChart runs one fixed check on every chart uploaded: the five marked points and their ratios, whether a reversal signal showed up at D, and whether trend structure and volume back the move, and it only grades the pullback that follows a confirmed turn, never the raw tag of the fixed completion ratio.
| Feature | SnapPChart | General AI chat assistant |
|---|---|---|
| Checks that D landed at the fixed 1.618 extension of XA, not an approximate zone | Yes, every upload | Inconsistent |
| Verifies B and C stayed inside their own windows (38.2%-61.8% of XA, 38.2%-88.6% of AB) | From the image | Rarely checked |
| Requires a confirmation signal at D before calling the setup tradeable | By design | Often guesses the reversal |
| Grades only the pullback after the confirmed turn, not the approach into the 1.618 zone | Every grade | Rarely |
| Flags an unconfirmed Crab: no signal, ratios off, still pressing toward D | Every bear case | Rarely flagged |
| Builds entry, a stop beyond the 1.618 extension, and targets from the confirmed move | Yes | Prompting required |
| Applies the identical checklist to every bullish Crab uploaded | Fixed methodology | Varies by session |
Learn the bullish Crab setup
These reads cover what makes the Crab's fixed 1.618 completion different from the rest of the harmonic family, so the grade makes sense instead of reading like a black box.
What do traders ask about Bullish Crab AI?
How SnapPChart grades a bullish Crab from your screenshot.
Does the AI call the reversal at point D?
No. That call is off the table for every harmonic pattern this site grades, and the Crab is no exception. The grade only switches on once a confirmation signal, a reversal candle, a bullish divergence, or a broken trendline, has already printed at the 1.618 extension of XA and a new uptrend is stacking higher highs on higher lows above it. A chart that has just touched that fixed ratio with nothing else showing reads as a decline that hasn't turned yet, not a setup to buy.
How does the AI grade a bullish Crab?
It works entirely from what you've marked on the screenshot: the X, A, B, C, and D points, the Fibonacci ratios labeled at each leg, whether a confirmation signal fired at D, whether a genuine uptrend has started, and the volume behind it. From there it grades the pullback that forms once that uptrend is confirmed, not the pattern's raw completion, and returns a grade, an entry on that pullback, a stop beyond the 1.618 extension past D, and profit targets. A Crab where D landed cleanly on that fixed ratio, ideally alongside a 2.24-3.618 extension of BC, and a confirmation signal printed outgrades one where the ratios are loose or nothing has confirmed.
Why is the Crab's D a fixed ratio instead of a range like the other patterns?
Because that's the one thing Carney built differently into this pattern. A Gartley's D sits near a 78.6% retracement inside the original XA leg. A Butterfly's D can land anywhere across a 127%-161.8% extension band beyond X. A Cypher's D is measured off an entirely different leg, the XC swing, not XA. The Crab drops the range altogether: D has to complete at exactly a 1.618 extension of XA, the single deepest, most extended print of any pattern in the family. Multiple sources on the pattern point out that pinning D to one number rather than spreading it across a band is what makes the Crab's reversal zone one of the tighter, more precise ones in harmonic trading, even though it reaches further than any of its siblings to get there.
Does the AI calculate the Fibonacci ratios or auto-detect the XABCD points?
No. It doesn't scan a feed for Crab setups, work out the 1.618 extension or the B and C retracements on its own, auto-detect the five swing points, or decide that D has turned. You draw the X, A, B, C, and D points and label every ratio with your charting platform's own Fibonacci tools, screenshot the chart with the confirmation signal and the new uptrend visible, then upload it. The AI grades only what's in that image: the marked structure, the labeled ratios, the confirmation signal, and the volume.
Can it tell a confirmed bullish Crab from one still unconfirmed at D?
That call shows up in the bear case. No confirmation signal yet, price sitting right at the 1.618 extension with nothing else happening, higher highs failing to form, or a reversal riding on weak volume all pull the grade down, and the trade plan says outright that the pattern hasn't confirmed. A clean confirmation signal at D, a real uptrend printing, and volume picking up behind it push the grade the other way.
Does it grade the bearish Crab too?
Yes, as the mirror image. A bearish Crab completes D at a fixed 1.618 extension above the XA leg instead of below it, and it's expected to lead into a decline rather than an advance. SnapPChart applies the identical rule in both directions: no call on the high at D, no shorting the zone the moment price arrives, and a grade only once a bearish confirmation signal, such as an evening star or a bearish divergence, has printed and a new downtrend is stacking lower highs and lower lows. One page covers both directions under that same rule.
What should be on the chart before I screenshot it?
Mark the five points, X, A, B, C, and D, and label the Fibonacci retracement and extension percentages on each leg, especially the 1.618 extension of XA that D completes on. The candles, timeframe, price scale, and volume all need to be visible, along with the confirmation signal at D and whatever uptrend has followed it. A chart with only the XABCD points marked and no confirmation signal yet leaves nothing for the AI to grade as a continuation.
Is there a free trial for bullish Crab grading?
Yes. Every new user gets two chart analyses for life, free. The first returns the full output so you can see exactly what a bullish Crab grade looks like end to end, and the second is partially gated to show what upgrading adds. No card required to try it.
Check whether your bullish Crab actually confirmed at its fixed 1.618 completion before you trade it.
Plot X, A, B, C, and D with the 1.618 XA ratio labeled, capture the confirmation signal and the new uptrend in the screenshot, then upload it from the homepage for a structured read on the setup.
Grade a Bullish Crab Free