Screenshot the trend, grade the power hour continuation.
Upload a chart from the final hour of the session, 3:00-4:00pm ET, with the day's established trend visible and get a read on whether that trend is continuing into the close, the volume behind it, and the EMA and VWAP context, plus a full trade plan, so a clean continuation and a late chase for a fresh high do not get judged the same way.
Drag and drop your chart screenshot
or click to browse. PNG, JPG, or WebP.
Your first analysis is free. No credit card.
Make sure both the time axis (X) and price axis (Y) are visible in your screenshot for accurate results.
Grade
B+
Entry
$3.87
Stop
$3.75
Target
$4.24
Sample readout
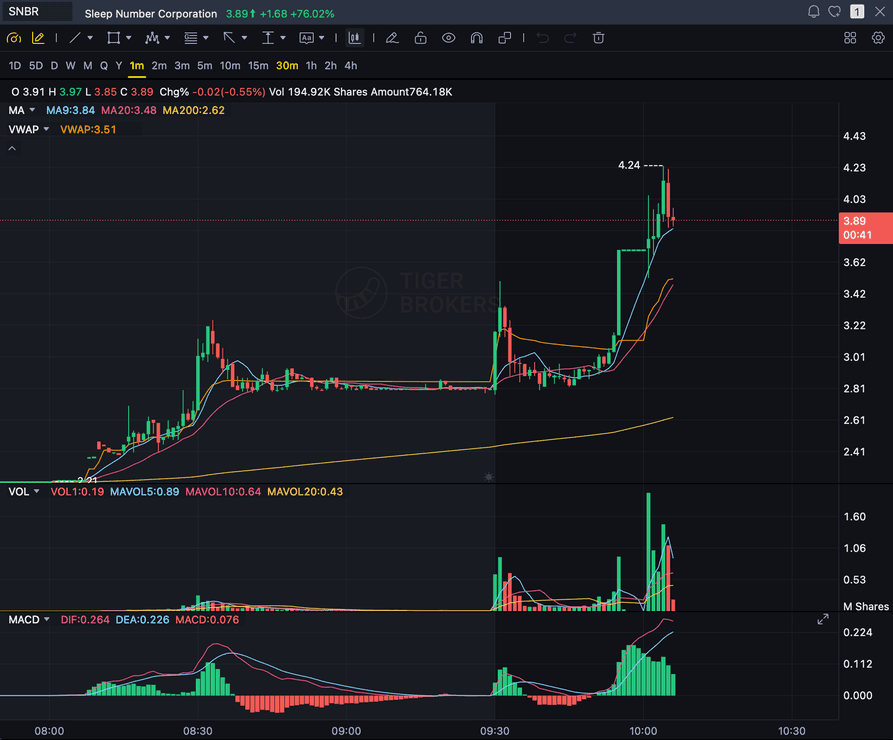
SNBR 1m bull flag pullback: strong opening momentum, lighter-volume consolidation, and a late breakout attempt with the 3.89 price marker near the current candle.
3-4PM ET
The final-hour window you screenshot
TREND
The day's already-established direction
VOLUME
Institutional and MOC-driven participation into the close
EMA / VWAP
Context confirming continuation, not a fresh breakout
Quick answer
What is power hour trading, and can AI grade it?
Power hour is the final hour of the US stock market session, 3:00-4:00pm ET, when institutional rebalancing and market-on-close imbalance orders drive a volume surge. The higher-probability setup is grading whether the day's already-established trend is continuing into the close, since a genuinely fresh new-day high or low in that final hour is actually the minority outcome, not the expectation.
SnapPChart grades that continuation from the chart you upload: it reads the day's established trend, the EMA and VWAP context, whether volume is confirming the move into the close, and nearby support or resistance, then returns a setup grade, an entry, a structural stop, multi-target exits, and the bear case. It does not know the actual wall-clock time, cannot verify the screenshot was taken during the 3:00-4:00pm ET window, and does not detect institutional order flow, market-on-close imbalance data, or index-rebalancing activity. You confirm you are trading the final hour and mark the day's established trend, structure, or level on the chart yourself, and the AI grades that marked structure the same way it grades any other setup. Data from edgeful.com found that a fresh new-day high or low in the final hour is genuinely uncommon: TSLA printed one only about 20% of the time over a 6-month sample, Dow futures (YM) about 15-20% of the time, and gold futures (GC) around 15% of the time for a new high and 9% for a new low, with the broader pattern landing between 12% and 24% across major instruments. That is why chasing a brand-new extreme late in the day is the lower-probability version of this setup, and grading continuation of the trend that already exists is the higher-quality read.
What the AI Returns From a Screenshot
Use the output as a repeatable pre-trade checkpoint, not a prediction.
A-F Setup Grade
See whether the setup has enough pattern clarity, momentum, volume, and reward to justify the risk.
Entry, Stop, Targets
Get a structured trade plan with entry zone, invalidation level, targets, and risk/reward.
Screenshot-Based Read
Use charts from TradingView, Webull, ThinkOrSwim, MetaTrader, Robinhood, or any broker.
Risk Notes First
The analysis flags extension, messy chop, weak retests, thin reward, and conflicting indicators.
Workflow
Use it as a quality check on the close
Power hour setups fail when a trader chases a brand-new high or low that most sessions never actually produce, instead of grading whether the day's real trend is still intact. SnapPChart gives you a consistent read before you commit into the close.
- Confirm you're in the final hour, 3:00-4:00pm ET, before you screenshot the chart
- Mark the day's established trend, structure, or key level on the chart yourself
- Check whether volume is confirming the continuation as the close approaches
- Read the EMA and VWAP context to see if the trend is genuinely intact
- Treat a fresh new-day high or low as the less likely outcome, not the goal
- Avoid opening a brand-new position in roughly the final 10 minutes of the session
Head to head
SnapPChart vs a general AI chat assistant for power hour setups
A general AI tool can describe a final-hour chart, but it will not grade the continuation to a fixed standard, and it has no way to know that a fresh new-day extreme this late in the session is actually the less likely outcome. SnapPChart checks the day's trend, the volume, and the EMA/VWAP context the same way on every screenshot you upload.
| Feature | SnapPChart | General AI chat assistant |
|---|---|---|
| Grades the final-hour continuation you screenshot | Yes, every upload | Inconsistent |
| Checks volume behind the move into the close | Every grade | Rarely |
| Flags a chase for a fresh new-day high or low as lower-probability | Every bear case | Rarely flagged |
| Reads EMA/VWAP context to confirm the trend is intact | From the image | Varies by prompt |
| Entry, stop, targets off the marked trend | Yes | Prompting required |
| Same criteria on every close | Fixed methodology | Varies by session |
Learn the power hour close
Use these guides to understand what makes a final-hour continuation grade well, so you take the read instead of the output blindly.
What do traders ask about Power Hour Trading AI?
How SnapPChart grades a final-hour continuation setup from your screenshot.
How does the AI grade a power hour continuation setup?
It reads the chart you upload for the day's already-established trend, whether volume is confirming that trend into the close, and the EMA and VWAP context around it, plus nearby support or resistance. It then returns a setup grade, an entry, a structural stop, and targets. A continuation that holds its trend with supporting volume grades higher than a late push that is thin on volume or already extended.
Does SnapPChart know what time it is, or detect institutional order flow and MOC imbalances?
No. It does not read the clock, cannot verify a screenshot was taken during the 3:00-4:00pm ET window, and does not detect institutional order flow, market-on-close imbalance data, or index-rebalancing activity. You confirm you are trading the final hour and mark the day's established trend or structure on the chart yourself. The grade reflects the structure in the picture you give it, not a live feed of order flow.
What's the difference between Power Hour and the ORB or London Breakout pages?
ORB and London Breakout both grade a breakout of a defined range at the start of a session: the opening range on any market for ORB, or the prior Asian session's range at the London open for forex. Power Hour is the opposite end of the day. There is no range to mark and no breakout to confirm; it grades whether the trend that already formed over the session is continuing into the final-hour close, a trend-continuation read rather than a range break.
Should I mark the day's trend before I upload a power hour chart?
Yes. SnapPChart reads the structure exactly as it appears on the chart; it does not calculate the day's trend itself and does not know which candles count as the final hour. Mark the trendline, the moving average price is riding, or the level you're using to define the trend, then screenshot the chart with the final hour visible and upload that.
Is chasing a fresh new high or low in the final hour a good idea?
Usually not, and that's the differentiation this page is built around. Data from edgeful.com found that a genuinely fresh new-day high or low in the final hour is the minority outcome: TSLA printed one only about 20% of the time over a 6-month sample, Dow futures (YM) about 15-20% of the time, and gold futures (GC) around 15% of the time for a new high and 9% for a new low, with the broader pattern landing between 12% and 24% across major instruments. Grading whether the existing trend is continuing is the higher-probability read; chasing a fresh extreme this late is the lower-probability one.
Is there a risk to entering in the last few minutes of the session?
Yes. Order-fulfillment quality tends to degrade in roughly the final 10 minutes as market-on-close imbalance orders and last-second institutional flow move price sharply. Most power hour guidance, including SnapPChart's own workflow above, treats that final stretch as a window to manage existing positions rather than open new ones.
What is the win rate of the power hour strategy?
SnapPChart does not track or claim a specific historical win rate for power hour continuation trades, or for any setup. The grade is a structural read of the chart you upload, not a backtest result, and outcomes vary with the instrument, how strong the day's trend was, and how tightly you marked it. Treat the grade as a pre-trade quality check, not a probability guarantee.
Is there a free trial for power hour grading?
Yes. New users get two lifetime chart analyses. The first shows the full output so you can see exactly what the power hour grade returns; the second is gated to show what the paid product adds. No credit card required.
Grade the continuation before you trade the close.
Confirm you're in the final hour, mark the day's trend, screenshot the chart, and upload it from the homepage for a structured read.
Grade a Power Hour Setup Free