Index chart analysis with AI: grade NAS100, US30, SPX, and DAX setups from a screenshot.
Upload a chart of the index you trade, whether it is the CFD your broker lists, the cash index, or the one on your prop firm account, and get a setup grade, entry, stop, targets, and the case against the trade before you enter.
Drag and drop your chart screenshot
or click to browse. PNG, JPG, or WebP.
Your first analysis is free. No credit card.
Make sure both the time axis (X) and price axis (Y) are visible in your screenshot for accurate results.
Market
SPX
Chart
5m
Read
Range
Risk
Whipsaw
Index readout
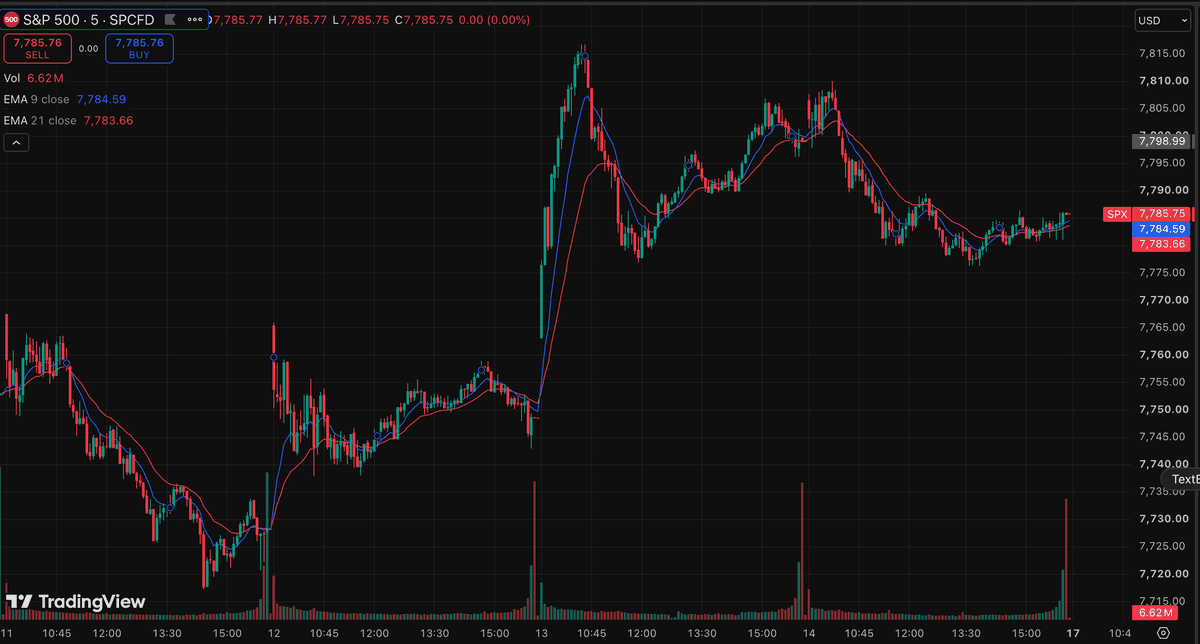
SPX sample readout: the 13th opens on a volume spike and expands off 7,748 to a high near 7,817. The following session tops near 7,810, a lower high, and price has since retraced to 7,785.75. The 9 and 21 EMAs have compressed to 7,784.59 and 7,783.66, under a point apart, with price crossing back and forth across both. Concern: a lower high with flat, intertwined moving averages is range behavior rather than trend, so this screenshot offers no directional edge.
NAS100
Nasdaq 100 / US100 tech-heavy index
US30
Dow Jones 30 and its big-figure levels
SPX
S&P 500 / US500 broad-market read
GER40
DAX 40 around the Frankfurt open
Quick answer
Can AI analyze an index chart?
Yes. Screenshot the index chart you trade, NAS100, US30, SPX, DAX, or any other, and upload it. SnapPChart reads the candles, trend, key levels, EMAs, and visible volume from the image, then returns a setup grade with an entry, a structural stop, targets, and the bear case.
The same index goes by different names depending on where you trade it. The Nasdaq 100 is NAS100, US100, or USTEC as a CFD and NDX as the cash index. The Dow is US30, the S&P 500 is SPX, US500, or SPX500, the DAX is GER40 or DE40, the FTSE 100 is UK100, and the Nikkei 225 is JP225. Most CFD versions trade close to 24 hours while the cash index only prints during its exchange session, so the same clock time can show different structure on two charts of the same market. SnapPChart does not know which version your screenshot came from and does not check it against another one. It grades the levels visible in the image, so screenshot the instrument you actually trade. It also does not read a live index feed, the economic calendar, or futures order flow.
What the AI Returns From a Screenshot
Use the output as a repeatable pre-trade checkpoint, not a prediction.
A-F Setup Grade
See whether the setup has enough pattern clarity, momentum, volume, and reward to justify the risk.
Entry, Stop, Targets
Get a structured trade plan with entry zone, invalidation level, targets, and risk/reward.
Screenshot-Based Read
Use charts from TradingView, Webull, ThinkOrSwim, MetaTrader, Robinhood, or any broker.
Risk Notes First
The analysis flags extension, messy chop, weak retests, thin reward, and conflicting indicators.
Workflow
Grade the index setup before you size in
Indices gap at the cash open, spike on data releases, and chop through the middle of the session. SnapPChart gives you the same read on the chart in front of you before you commit, whether it is NAS100 at the New York open or the DAX an hour after Frankfurt.
- Grade a NAS100 or US30 opening-range breakout before you chase it
- Check a DAX pullback into the 21 EMA after the Frankfurt open
- Grade the same setup on SPX and NAS100 and take the cleaner chart
- Read the bear case before you size a position on a funded account
- Skip the C-grade chop in the middle of the session
- Re-grade the chart after a pullback to see if the entry got cleaner
Head to head
SnapPChart vs a general AI chat assistant for index chart analysis
A general AI chat tool can describe a NAS100 or DAX chart, but it answers in prose that shifts between uploads. SnapPChart returns the same fields on every index, so a US30 read today is comparable to a Nikkei read tomorrow.
| Feature | SnapPChart | General AI chat assistant |
|---|---|---|
| Reads index chart screenshots (NAS100, US30, SPX, DAX, and more) | Yes, every upload | Inconsistent |
| Setup grade on a fixed scale | Yes | No |
| Entry, stop, and targets on the index's own price scale | Yes | Varies by prompt |
| Bear case and invalidation on every chart | Every result | Rarely flagged |
| Same criteria across US, European, and Asian indices | Fixed methodology | Varies by session |
| Grade history to review your index setups | Yes | No |
Grade a specific index
One page per index, with the broker names, sessions, and quirks for that market. Trading the futures contract instead of the index? The futures page covers ES, NQ, YM, and RTY.
What do traders ask about AI index chart analysis?
How SnapPChart grades stock index chart screenshots.
Which indices can SnapPChart grade?
Any index chart you can screenshot. That covers the US indices (NAS100, US30, SPX or US500, US2000), Europe (DAX or GER40, FTSE 100 or UK100), Asia (Nikkei 225 or JP225, Hang Seng or HK50, KOSPI, TAIEX, China A50), and India (Nifty 50, Bank Nifty, FINNIFTY, Sensex). The AI reads the chart image, not the ticker, so it grades an index your broker names differently the same way.
Does it matter whether I trade the CFD, the cash index, or the futures?
It matters for what you screenshot, not for how the grading works. A CFD like NAS100 usually trades close to 24 hours, the cash index only prints during its exchange session, and the futures (NQ, ES, YM, RTY) carry their own session and rollover. The same clock time can look different on each. SnapPChart grades the image you upload and does not reconcile it against another version, so screenshot the one you actually trade. For the futures contracts, see the futures chart analysis page.
Does it read live index data or the economic calendar?
No. SnapPChart grades the screenshot you upload, not a live feed. It does not pull the economic calendar, see futures order flow, or predict the next candle. It reads the structure, levels, and EMA context visible in the image and returns the trade plan and the bear case. You stay the one making the call.
Is it useful for prop firm index trading?
Yes, as a pre-entry check. NAS100, US30, and GER40 are some of the most traded instruments on funded accounts, and a grader that returns the same fields every time lets you compare one index setup to the next and skip the chop that eats into a daily loss limit. It does not connect to your prop firm account or track your drawdown.
Can it grade an index short setup?
SnapPChart grades long and short momentum-continuation setups from chart screenshots. Choose Long only, Short only, or Both sides in your trading profile. Both sides picks one direction from the chart.
Is index chart analysis free to try?
Yes. New users get two lifetime chart analyses, no credit card required. The first shows the full result so you can see what the AI returns on an index chart; the second is gated to show what the paid product adds.
Grade your next index setup before you enter.
Upload a NAS100, US30, SPX, DAX, or any other index chart screenshot and get a setup grade, trade plan, and the case against the trade in seconds. No credit card required.
Grade an Index Chart Free